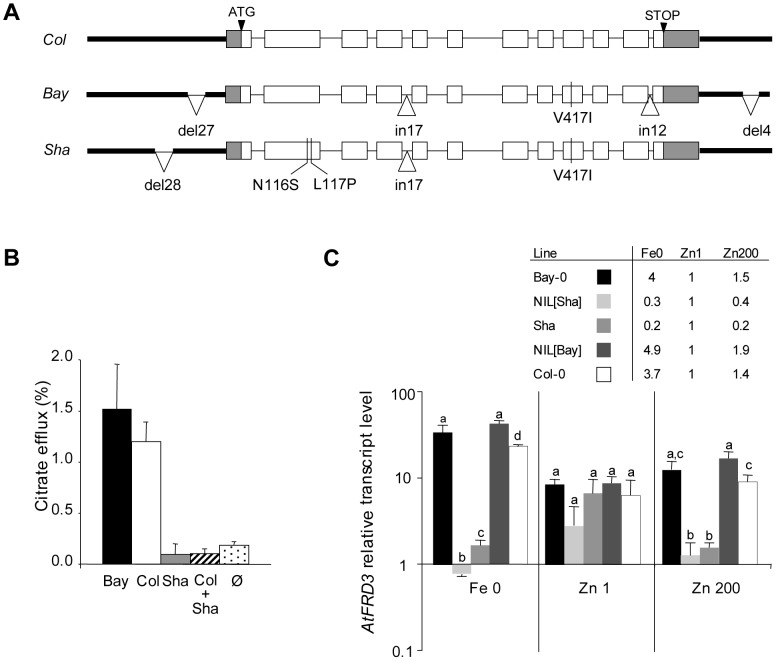
Figure 3. Natural variation in the FRD3 sequence, FRD3 transport activity, and FRD3 transcript accumulation.
(A) Gene organization and allelic variations identified at the FRD3 locus in Col-0 (reference sequence), Bay-0 and Sha. In non-coding regions, only insertions and deletions are shown. In the coding region, synonymous SNPs are not indicated. (B) 13[C]-citrate efflux activity resulting from the expression of FRD3Bay (Bay), FRD3Col (Col) and FRD3Sha (Sha) proteins or the co-expression of FRD3Sha and FRD3Col (Col+Sha) in Xenopus oocytes. In control oocytes (Ø), no RNA was injected. Data are the means ± S.D.M. for n = 3 sets of 14 oocytes. (C) FRD3 transcript accumulation under Fe deficiency (Fe 0), control conditions (Zn 1) and excess Zn (Zn 200) in parental and NIL lines. FRD3 transcript levels are shown relative to the transcript level of ACT2/ACT8. Values represent the means ± S.D.M. for n = 3 biologically independent experiments. Different letters above bars indicate significantly different values within a treatment set (P<0.05) according to a non-parametric test for Fe0, and Zn200 and a Tukey test for Zn1. The table indicates FRD3 transcript levels for the Fe0 and Zn200 conditions relative to those for the control Zn1 condition.

