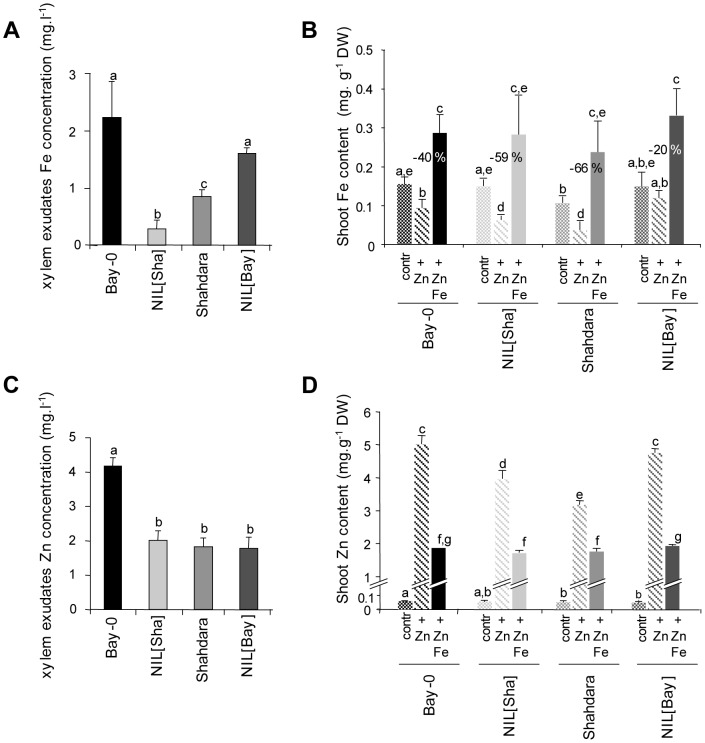
Figure 4. Fe and Zn homeostasis in NILs and parental lines.
Fe (A) and Zn (C) concentrations in xylem exudates. Plants were grown in a growth chamber for 6 weeks and xylem exudates were collected during 30 min after removing aerial parts of the plant at the hypocotyl. Fe (B) and Zn (D) shoot content. Plants were grown on agar plates under control (contr.), 200 µM Zn (+ Zn), and 200 µM Fe plus 200 µM Zn (+ Zn Fe) conditions for 10 days. Percentages given above bars in (B) refer to the difference in shoot Fe content in ‘+ Zn’ conditions as a percentage of the control value. Measurements were performed on sets of 5 to 20 plants. Values are the means ± S.D.M. Different letters above bars refer to significantly different values (P<0.05), according to non-parametric tests for (A), (B) and (D) and Tukey tests for (C) where n = 3–8.

