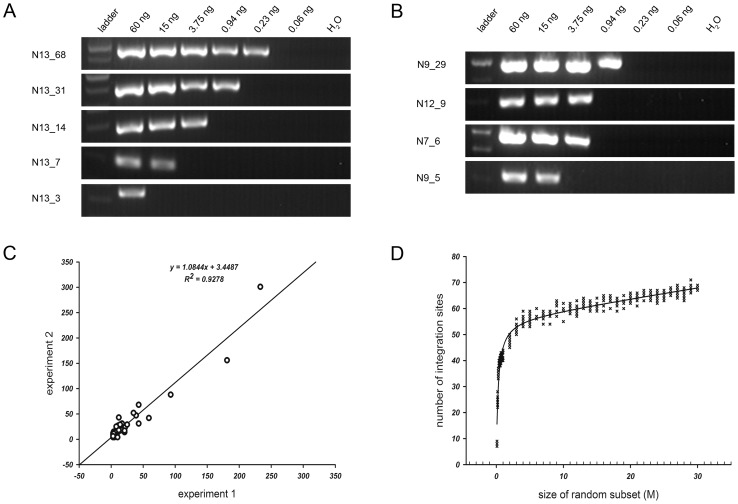
Figure 5. Quantitative feature of MAPS.
(A) Semi-quantitative PCR results in HCC DNA sample N13. Each panel represents different integration frequencies, judged by the number of unique tags identified by MAPS, as indicated by the number followed by the sample name on the left column labels. The amounts of genomic DNA used for PCR were indicated at the top of the lanes. (B) Semi-quantitative PCR results in multiplexed DNA samples. The left column indicates the HCC DNA sample identifications and the number of unique tags identified. (C) Correlation co-efficiency (R2 = 0.9278) of the numbers of unique tags covering the common insertions retrieved between two technical replicate runs. (D) Rarefaction analysis of integration sites recovered in MAPS.

