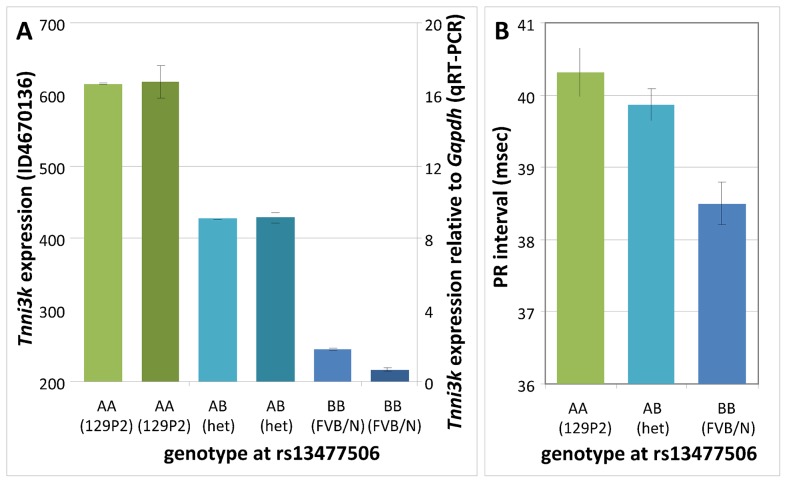
Figure 2. Genotype effects at rs13477506.
(A) Tnni3k expression (Illumina probe ILMN_3023962) as a function of genotype at rs13477506 in F2 mice; homozygous 129P2: AA, green; 129P2-FVBN/J heterozygous: AB, turquoise; homozygous FVBN/J: BB, blue; the darker shades represent the independent validation of the Tnni3k transcription levels by Q-PCR (right y-axis). (B) PR interval as a function of genotype at rs13477506 in F2 mice. Error bars indicate standard errors.

