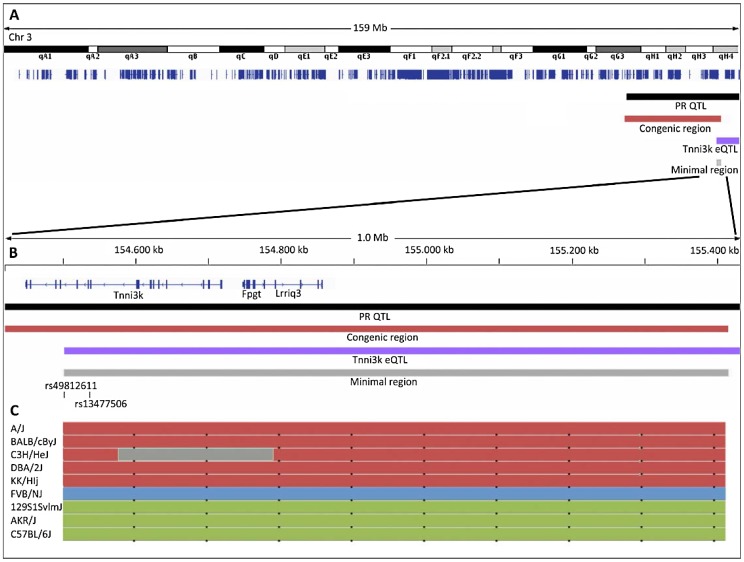
Figure 3. Overview of the locations of the linkage regions on chromosome 3.
(A) Entire mouse chromosome 3 with refseq genes indicated in dark blue, black bar: 1.5 LOD drop of the PR-QTL; dark red bar 20 Mb DBA.AKR congenic region; purple bar 1.5 LOD drop of the Tnni3k eQTL; grey bar minimal region of overlap. (B) 1 Mb close up of the minimal region of overlap; the positions of rs49812611 (associated with nonsense mediated decay in DBA/2J) and rs13477506 (QTLs) are indicated. (C) Haplotypes of a panel of 9 inbred mouse strains as determined by the mouse phylogeny viewer (http://msub.csbio.unc.edu/) [19].

