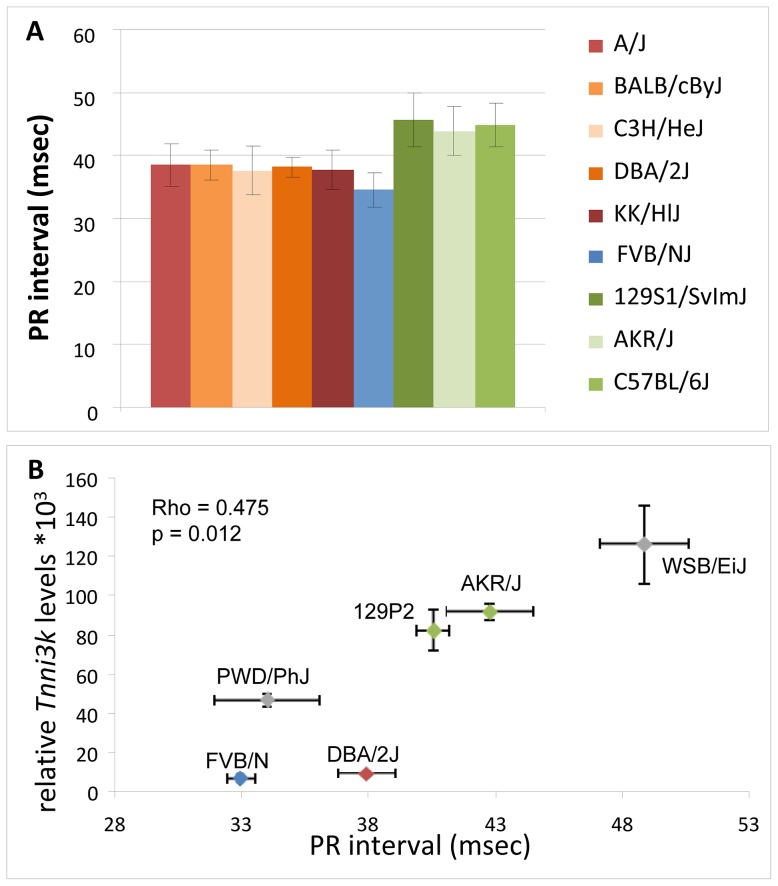
Figure 4. In silico and in vivo correlation of Tnni3k levels and PR interval duration.
(A) In silico analysis: mouse inbred lines are colored based on the haplotypes in the minimal region of overlap; PR interval duration obtained from the mouse phenome database (http://phenome.jax.org/) FVBN/J (blue) (low expression) and green (high Tnni3k expression), inbred lines with the reddish colors carry rs49812611 (associated with nonsense mediated decay). (B) In vivo analysis of Tnni3k expression levels (y-axis) and PR interval duration (x-axis) in six inbred mouse lines, colors again denote the haplotype (gray is unknown haplotype).

