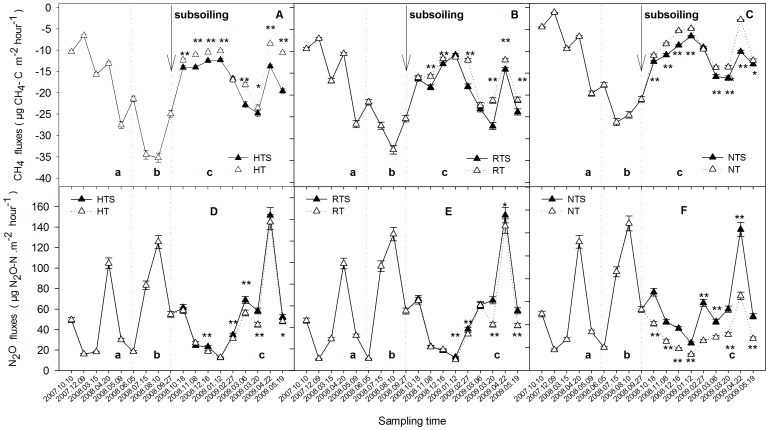
Figure 2. A to C CH4 flux variations of H, R, and N after subsoiling in different periods; D to F N2O flux variations of H, R, and N after subsoiling in different periods.
a in Fig. 2 is the wheat growth stage of 2007 to 2008; b is the maize growth stage of 2008 to 2009; c is the wheat growth stage of 2008 to 2009. Arrows indicate time of subsoiling. Dotted lines distinguish the growth period of wheat and maize. * indicates P<0.05 and **indicates P<0.01 between subsoiling and the control.

