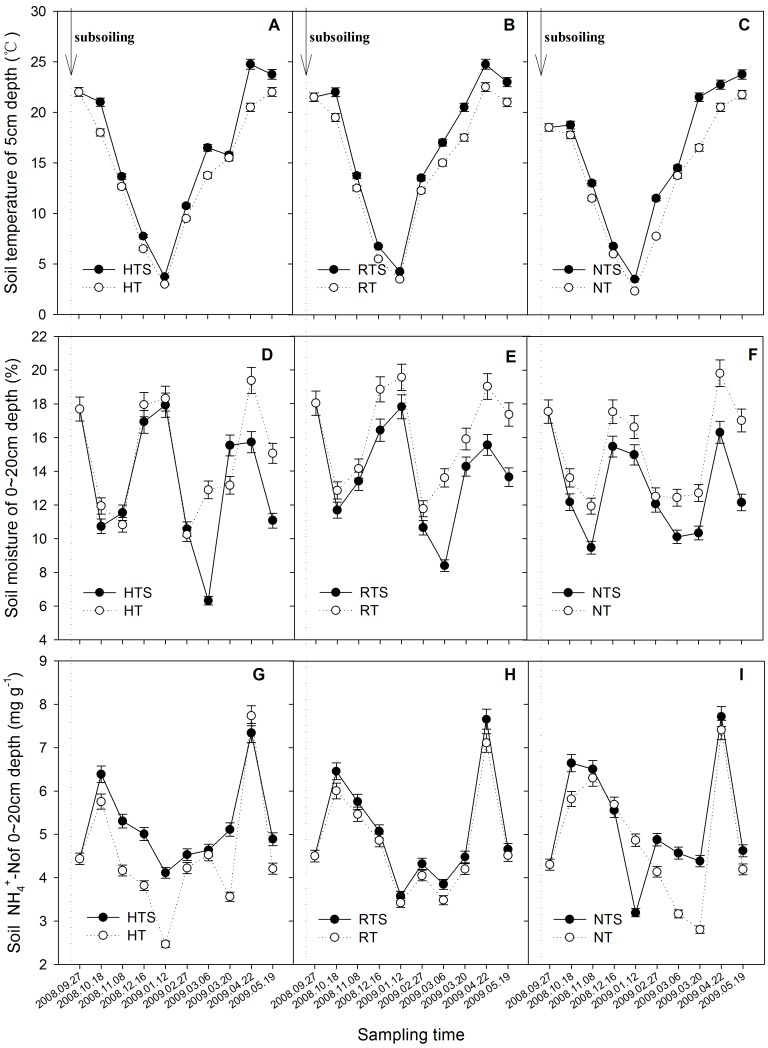
Figure 5. A to C Variation of Soil temperature at a 5 cm depth (°C) after subsoiling; D to F Variation of Soil water content at a 0∼20 cm depth (%) after subsoiling; G to I Variation of Soil NH4 +-N at a 0∼20 cm depth (mg·kg−1) after subsoiling.
Arrows and the dotted line indicate time of subsoiling.

