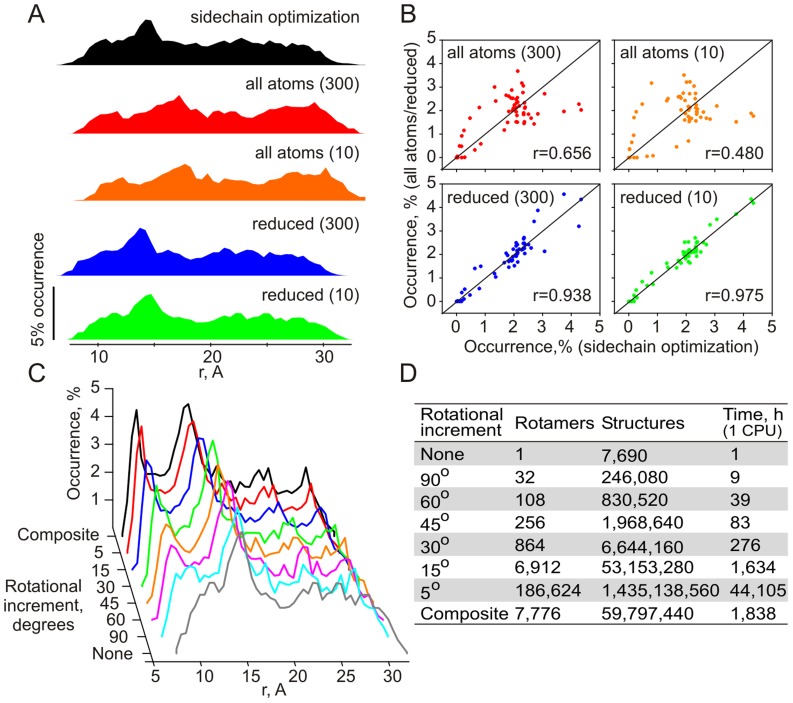
Figure 2. Conformational sampling in the Cc-Cb5 complex.
(A) Distribution of the heme-heme distances in the simulation runs with the full vdW potential and side-chain optimization (black); full vdW potential without side-chain optimization (vdW cut-off values of 300 kcal/mol and 10 kcal/mol; red and orange, respectively); and reduced vdW term, set to zero for all atoms extending beyond Cβ (vdW cut-off values 300 kcal/mol and 10 kcal/mol; blue and green, respectively). In these runs, only translational degrees of freedom of Cc were simulated. (B) Correlation plots of heme-heme distance occurrences in the side-chain optimization run (horizontal axis) and the other control runs (vertical axis), color-coded as in (A). Pearson correlation coefficients are indicated in the plots. (C) Distribution of the heme-heme distances in the runs with the reduced vdW term (vdW cut-off 10 kcal/mol, green dataset in A) and a given rotational increment (δχ = δψ = δξ, 0°≤χ, ψ<360°, 0°≤ξ<180°). For the composite run, δχ = δψ = 5°, δξ = 15°; −45°≤χ, ψ≤45°, 0°≤ξ<360°. (D) Number of rotamers for each Cc CM, the total number of structures sampled per run, and the total run time (for 1 CPU).

