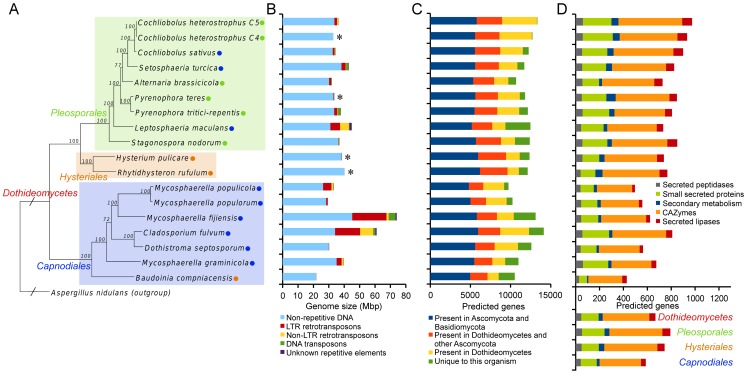
Figure 2. Phylogeny and genome characteristics of the 18 studied Dothideomycetes.
A. Genome-based phylogenetic tree of 18 Dothideomycetes computed using 51 conserved protein families. Bootstrap values are indicated on the branches. Lifestyles and strategies of pathogenesis (green circle for necrotrophs, orange circle for saprotrophs and blue circle for [hemi]biotrophs) are indicated. Aspergillus nidulans was used as an outgroup and its branch on the tree is not drawn to scale. B. Genome size and repeat content. Repeat content varies widely among Dothideomycetes, but in general the largest part consists of long terminal repeats. Asterisks indicate genomes that were sequenced exclusively with Illumina technology. Repeat content in these genomes is likely an underestimate. C. Number of predicted genes, broken down by level of conservation. D. Gene counts of classes that have been implicated in plant pathogenesis. Members of Capnodiales have fewer genes in these classes than Pleosporales and Hysteriales (with the exception of Cladosporium fulvum). This trend is also illustrated by the estimated gene counts for the last common ancestors of the indicated taxa (below the x-axis), which correspond to the taxa in (A). See also Figure S3. Bars on all graphs (B, C, and D) correspond to the organisms on the tree in (A).

