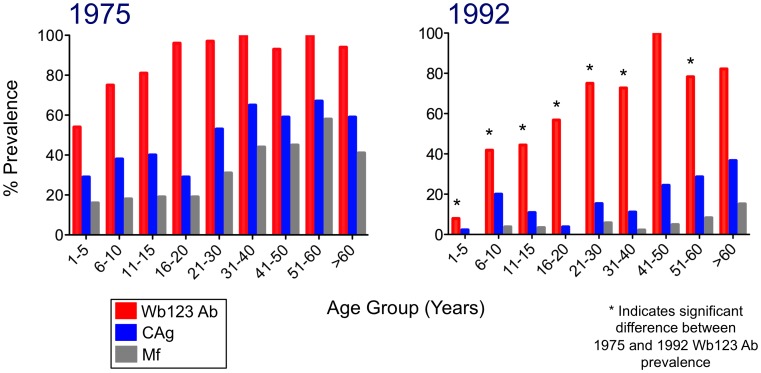
Figure 1. Prevalences of Ab to Wb123, CAg, and Mf in 1975 and 1992.
Percent prevalence (y-axis) of microfilaremia (Mf; grey bars), circulating antigen (CAg; blue bars), and Ab to Wb123 (red bars) by age group (x-axis) for the study population on Mauke in 1975 (left panel) and 1992 (right panel). Asterisks represent a significant difference (p≤0.004; Fisher's exact test) between Wb123 Ab prevelances in 1975 and 1992 within a given age group.

