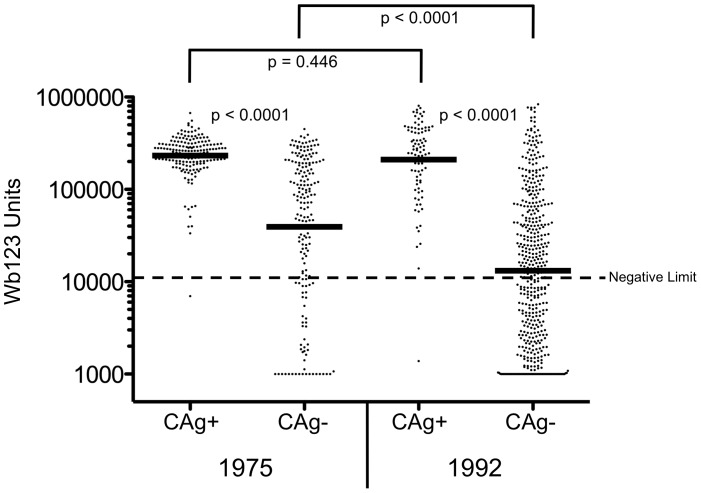
Figure 3. Levels of Ab to Wb123 by CAg Status in 1975 and 1992.
Ab levels to Wb123 segregated by CAg status in subjects from 1975 (left side) and 1992 (right side). Each dot represents an individual patient, and the black bars represent the geometric means. The dashed line represents the lower limit of the assay (10,968 units) and p-values were calculated using the Mann-Whitney U test.

