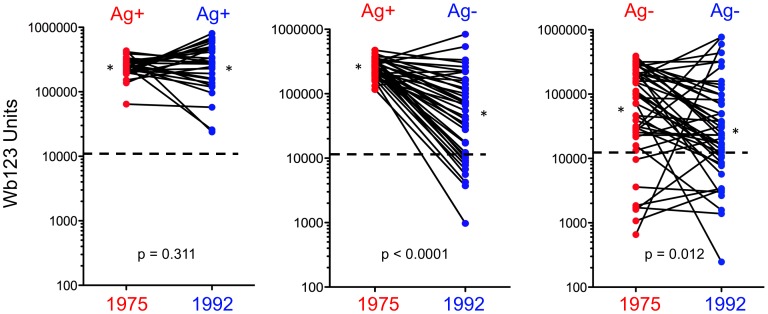
Figure 4. Levels of Ab to Wb123 in Patients Seen in Both 1975 and 1992.
Change in the production of Ab to Wb123 as measured by LIPS in individuals seen in both 1975 (red dots) and 1992 (blue dots) segregated by CAg status. Each line represents an individual patient (n = 28 [CAg+ to CAg+]; n = 40 [CAg+ to CAg−]; n = 46 [CAg− to CAg−]); asterisks represent the geometric means for each group. The dashed line in each graph represents the upper limit of the normal level (10,968 units) of the LIPS assay and p-values were calculated using the Wilcoxon Signed Rank test.

