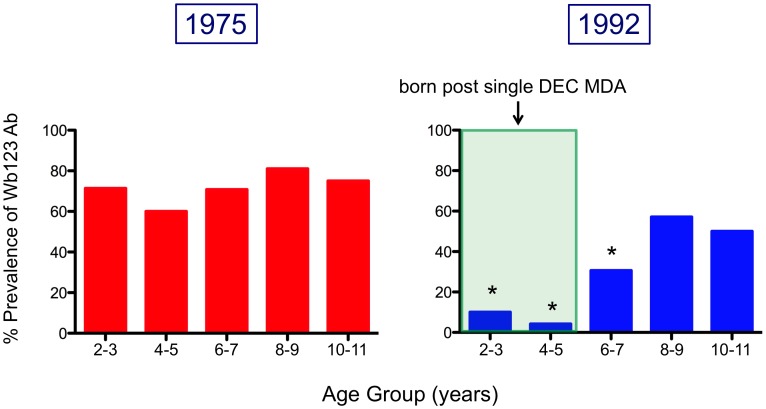
Figure 6. Prevalence of Ab to Wb123 in Children from 1975 and 1992.
Prevalence of Ab to Wb123 (i.e. the percent positive for Ab) in children ≤11 years old by 2 year age divisions in 1975 (left panel; red bars) and 1992 (right panel; blue bars). The shaded green area represents the period of time where children were born after island-wide treatment with DEC. Asterisks indicate a significant difference (p≤0.0045) by Fisher's Exact test between identical age groups from both time periods.

