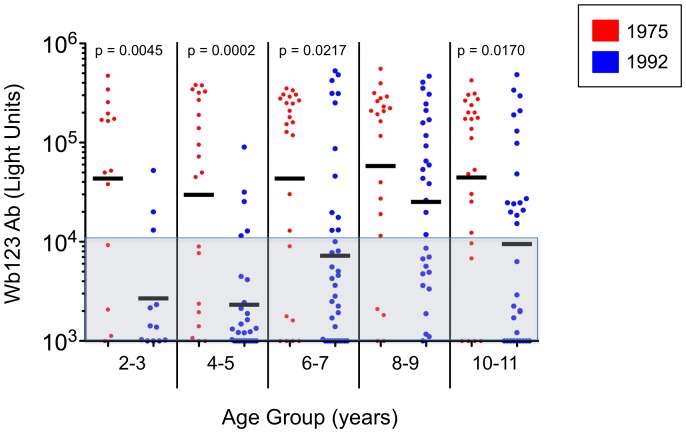
Figure 7. Levels of Ab to Wb123 in Children from 1975 and 1992.
Ab levels to Wb123 in children ≤11 years old by 2 year age divisions in 1975 (red dots) and 1992 (blue dots). Each dot represents a single individual and the black bars represent the geometric means for each group. The shaded grey area indicates values considered negative and p-values were calculated using the Mann Whitney U test.

