
Figure 4. Phases of the annual component of incidence for districts located along two geographic axes.
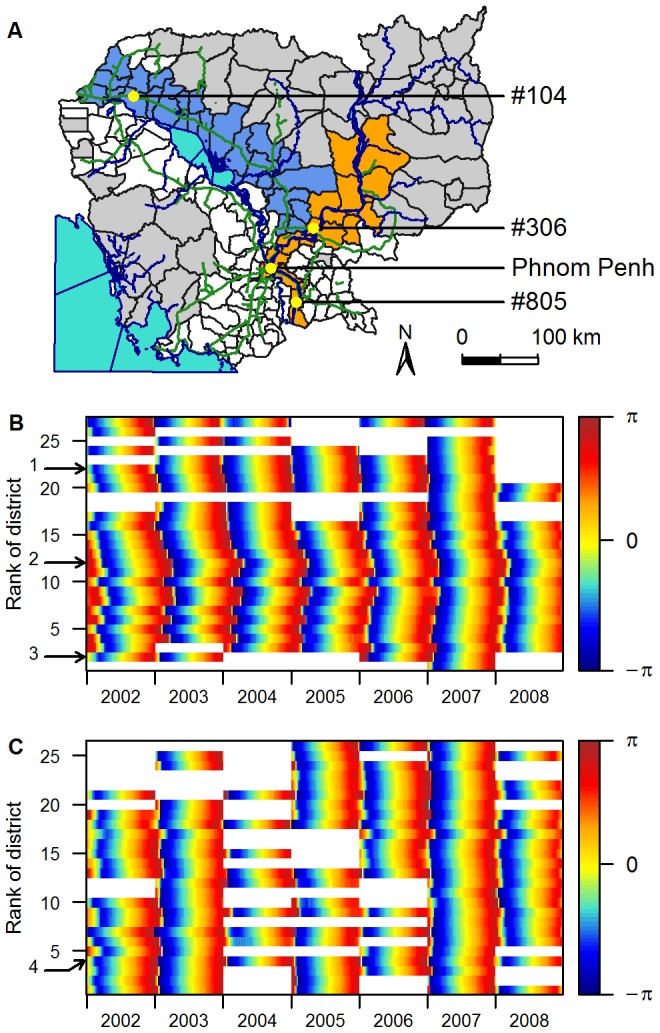
Phases are computed in the 0.8–1.2 year periodic band. (A) Map of the two geographic areas chosen: the national road in blue, and the Mekong River in orange. (B) Phase of districts along the Mekong River (orange in Figure 4A), presented from the most southerly to the most northerly from bottom to top. (C) Phase of districts along the national road (blue in Figure 4A), presented from West to East from bottom to top. The arrows indicate districts: 1, #306; 2, Phnom Penh; 3, #805 (Figure 4B); 4, #104 (Figure 4C).