
Figure 1.
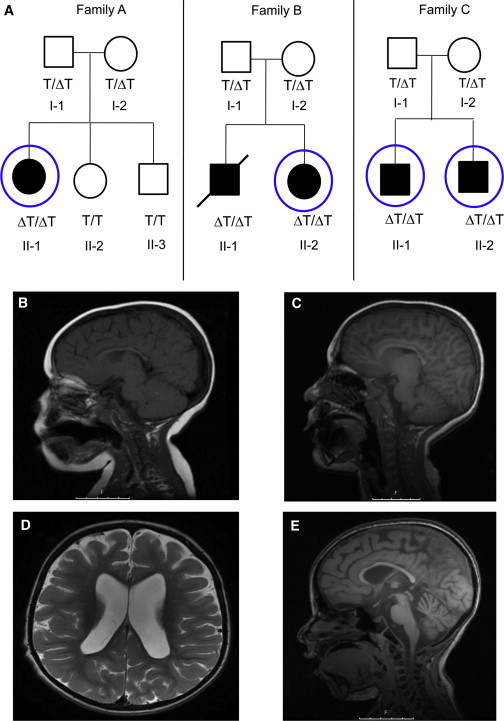
Pedigrees and Neuroimaging Phenotypes
(A) Pedigrees of the three Jewish Bukharian families. Filled symbols represent affected individuals, roman numerals indicate generations, and numbers are serial within the family. The slash represents the deceased individual with DNA available from a remaining muscle biopsy. TECPR2 genotype status for the c.3416delT variant is indicated by ΔT/ΔT for a homozygous mutation, ΔT/T for a heterozygous mutation, and T/T for a wild-type form. Circles indicate individuals who underwent exome sequencing.
(B) A T1 sagittal MRI from individual II-1 in family A shows a thin corpus callosum at the age of 3 years.
(C) A T1 sagittal MRI from individual II-1 in family A shows progressive cerebellar vermian atrophy at the age of 10 years.
(D) A T2 axial MRI from individual II-2 in family C at the age of 7 years shows enlarged lateral ventricles and deep sulci, indicating cerebral atrophy.
(E) A T2 sagittal MRI from individual II-2 in family C at the age of 7 years shows deep cerebral sulci (indicating cerebral atrophy), a thin corpus callosum, and vermian atrophy.