
Figure 2.
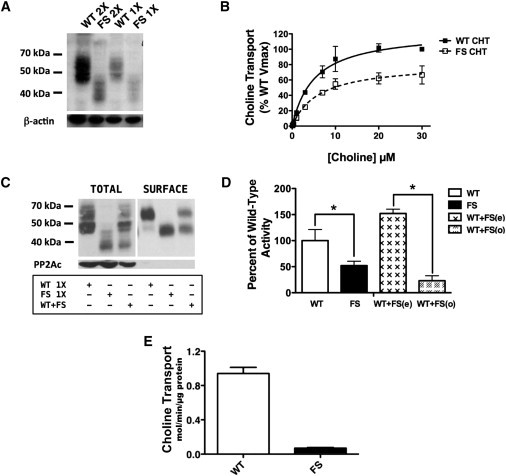
Immunoblotting and Cell-Surface Biotinylation of WT and FS CHT
(A) Levels of total WT and FS CHT after SDS-PAGE and immmunoblotting with HA antibody confirm FS-CHT truncation and reveal reduced expression of total FS CHT at both 2× (lanes 1 and 2) and 1× (lanes 3 and 4) protein. Stripping and blotting for β-actin reveal equal protein loaded across lanes. All experiments were conducted with the same total amount of transfected plasmid and were balanced with a pcDNA3 vector.
(B) Saturation analysis of HC-3-sensitive choline-transport activity in transfected HEK 293 cells demonstrates significantly reduced transport activity for FS CHT than for WT CHT. Transport deficits of FS-CHT-transfected wells are accounted for by a reduction in choline transport VMAX (33.4% reduction, p = 0.024, Student’s unpaired t test) as opposed to a change in choline KM (WT = 5.15 ± 1.12 μM, FS = 6.12 ± 1.72 μM, p = 0.66, Student’s unpaired t test). Specific choline uptake was determined by subtraction of the uptake obtained from transfected cells from that obtained from mock (vector) transfected cells acquired from assays conducted in parallel.
(C) Levels of total and surface WT and FS CHT are lower in cells transfected with both WT and FS CHT at 1× levels (as presented in A) than in cells separately transfected at 1× levels. All transfections were performed with identical amounts of total plasmid and were balanced by a pcDNA3 vector. Equivalent findings were obtained with cells transfected with the tagged WT and FS CHT constructs.
(D) Choline-transport activity is lower in FS CHT than in WT CHT (n = 5, ∗p = 0.035, Student’s unpaired t test). Observed transport activity of cells coexpressing WT and FS CHT (WT + FS(o)) falls significantly below that expected (WT + FS(e)) from a sum of the independent expression of these isoforms (n = 5,∗p = 0.005, Student’s unpaired t test).
(E) HC-3-sensitive choline-transport activity in whole-blood monocytes of dHMN-VII subjects (n = 4) and controls (n = 11) reveals a dramatic loss in dHMN-VII subjects (∗p = 0.72 × 10⁻⁶, Student’s one-tailed t test).