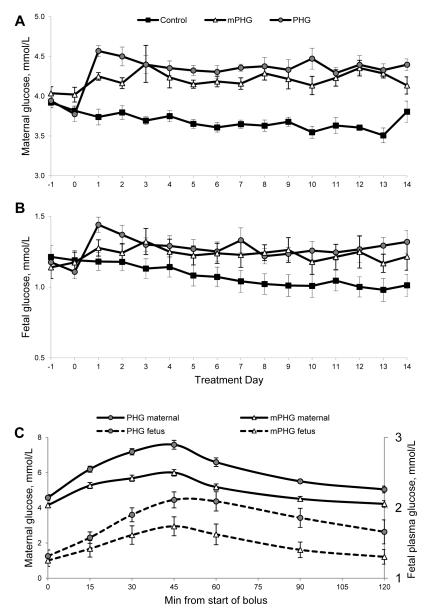
Figure 1. Maternal (A) and Fetal (B) Plasma Glucose Concentrations.
Sustained mild (mPHG) or moderate (PHG) hyperglycemia was initiated on day 0. Plasma was sampled prior to initiating treatment on day 0 and prior to the 0800 dextrose pulse daily thereafter. Panel C shows maternal and fetal plasma glucose concentrations during the 45-min dextrose pulse administered at 1400 on day 9 of treatment. The two-hour sampling period illustrates the magnitude and duration of hyperglycemia resulting from one of the dextrose pulses, which were given 3x/day throughout the treatment period.

