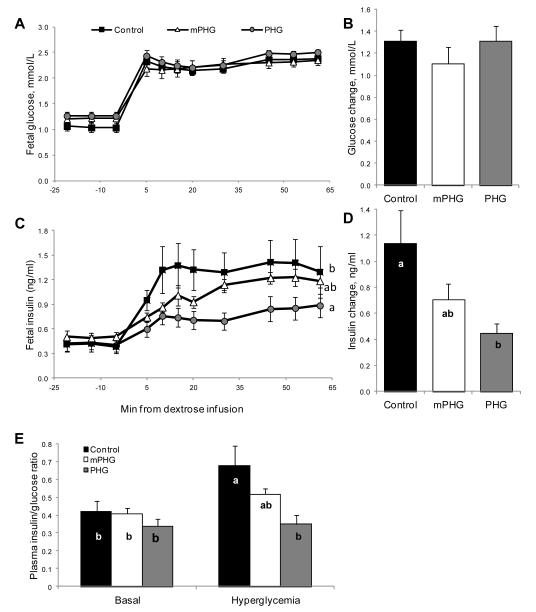
Figure 3. Impaired Glucose Stimulated Insulin Secretion in PHG Fetuses.
Graphs A and C show mean plasma glucose and insulin concentrations during basal (−21 to 0 minutes) and hyperglycemic (after time 0) periods. The bar graphs show the changes in glucose (B) and insulin (D) between the basal and hyperglycemic (45-61 minutes) steady state periods, which were calculated as the difference between hyperglycemia and basal mean concentrations. The elevation in glucose was similar between treatments, but PHG fetuses had a lower insulin response than control fetuses (P<0.05). Plasma insulin/glucose ratios (panel E) are shown for basal and hyperglycemic steady state periods. Bars not sharing the same letter are different, P<0.05.

