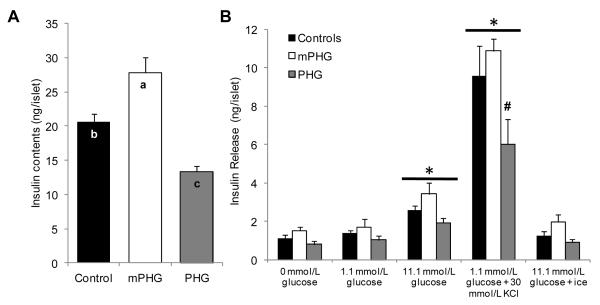
Figure 5. Decreased Insulin Content and Release in PHG Islets.
In panel A, mean insulin content (ng/islet) is presented for islets isolated from control (n=7), mPHG (n=5), and PHG (n=8) fetuses (indicated on the x-axis). In panel B, insulin release (ng/islet) is presented for static incubations in KRB/BSA media containing 0 mmol/L glucose, 1.1 mmol/L glucose, 11.1 mmol/L glucose, 30 mmol/L KCl and 1.1 mmol/L glucose, or 11.1 mmol/L glucose incubated on ice (indicated on the abscissa). Insulin release was increased in 11.1 mmol/L glucose and 30 mmol/L KCl compared to incubation with 0 and 1.1 mmol/L glucose, and is indicated by the horizontal bars with an asterisk (P<0.05). In the PHG islets, KCl stimulated insulin release was less than control and mPHG islets, which is indicated with the number symbol (P<0.05).

