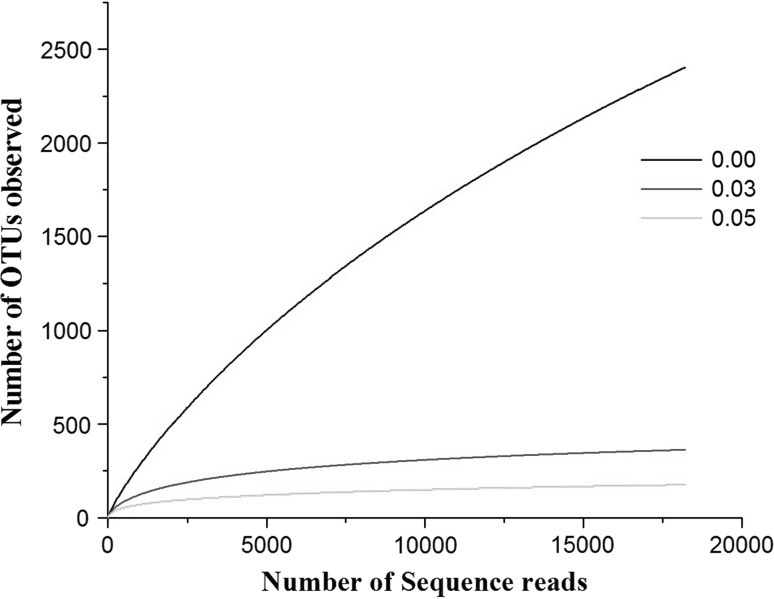
Fig. 1.
Rarefaction curves representing the richness of the pyrosequencing reads with distance values (dissimilarity level) of 0 (unique), 3 (0.03) and 5 % (0.05). The vertical axis shows the number of OTUs that would be expected to be found after sampling the number of tags or sequences shown on the horizontal axis

