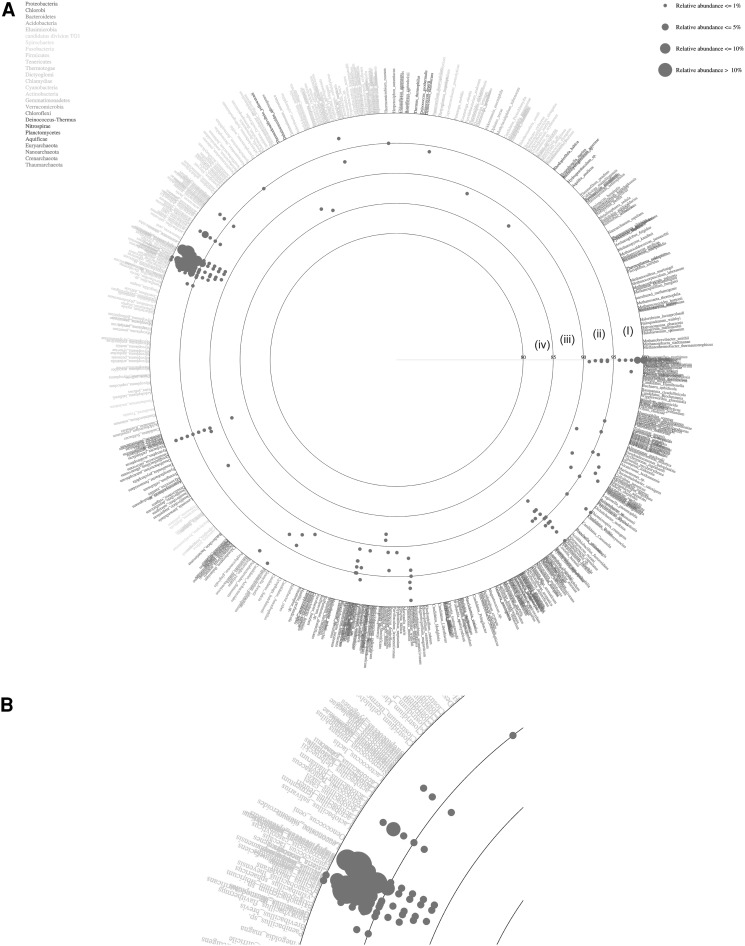
Fig. 4.
a Vitcomic map representing the species diversity of the sample, based on the comparison of the reads against the NCBI non-redundant database using the blastn tool. Large circles indicate boundaries of BLAST average similarities, inner most circle (iv) 80–85 %, followed by (iii) 85–90 %, (ii) 90–95 %, (i) 95–100 % similarity of the database sequence. b High-resolution view of the region containing the predominant phylum firmicutes. The Larger size dots indicate the relative abundance of the particular taxon is more than 10 % of the sample sequence

