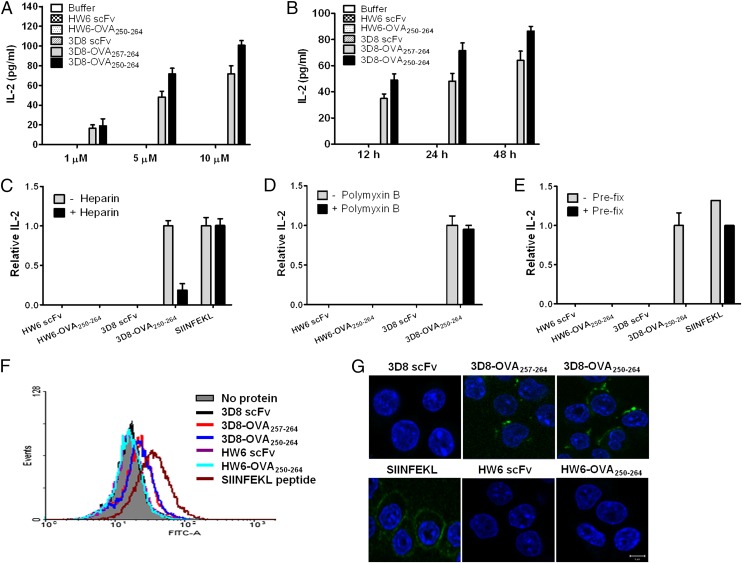
FIGURE 4.
Cross-presentation of 3D8-OVA fusion proteins by DC2.4 cells. (A and B) DC2.4 cells and CD8OVA1.3 T cells were cocultured in the presence of the indicated proteins at the indicated concentrations for 24 h (A) or at 5 μM for the indicated times (B). IL-2 levels in the culture supernatant were then measured. Data represent the mean ± SE of triplicate samples. (C and D) DC2.4 cells were pulsed with the indicated proteins (5 μM) in the presence or absence of either polymyxin B (20 μg/ml) or heparin (50 IU/ml) for 6 h. DC2.4 cells were washed, fixed, and then incubated with CD8OVA1.3 T cells for 24 h at 37°C. (E) Prefixed DC2.4 cells were pulsed with the indicated proteins (5 μM) for 6 h and then incubated with CD8OVA1.3 T cells for 24 h at 37°C. (C–E) IL-2 levels were measured in the culture supernatant and expressed as a ratio against the amount of IL-2 in the absence of heparin, polymyxin B, and prefixation. Data represent the mean ± SE of three independent experiments. (F and G) Flow cytometric analysis (F) and confocal microscopy (G) of DC2.4 cells pulsed with the indicated proteins (5 μM) for 6 h at 37°C and labeled with a biotin-conjugated Ab specific for the H-2Kb–OVA257–264 complex and FITC-Streptavidin. Nuclei were stained with Hoechst 33342. Scale bars, 10 μm. Data are representative of two independent experiments.

