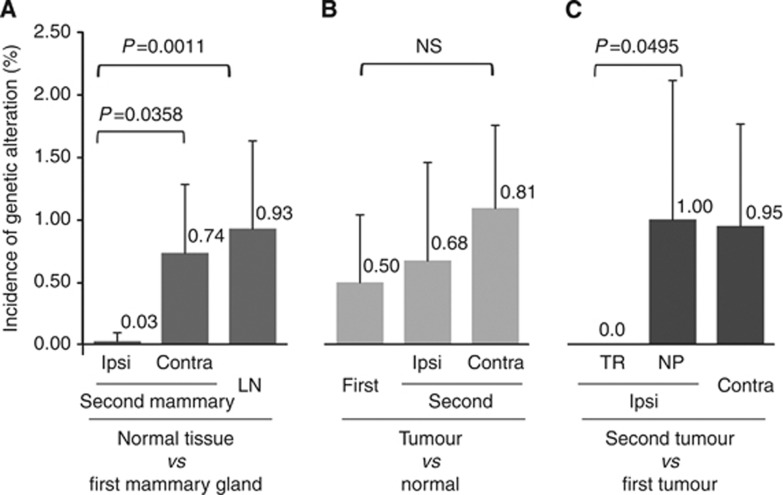
Figure 4.
The incidence of genetic alterations in normal tissue vs primary and secondary tumour tissues. The proportion of number of altered bases to the number of bases examined in the D-loop region (567 bp) is shown as the incidence of genetic alteration (%). (A) The incidence of genetic alterations detected in the secondary mammary gland (ipsilateral and contralateral) and lymph-node tissue, in comparison with the primary mammary gland, is presented. (B) The incidence of genetic alterations detected in a tumour, in comparison with the non-neoplastic mammary gland, is presented. (C) The incidence of genetic alterations in secondary tumours, in comparison with, a primary tumour is presented. The incidences were compared and statistically analysed using the Mann–Whitney test. contra=contralateral; Ipsi=ipsilateral; LN=lymph node.

