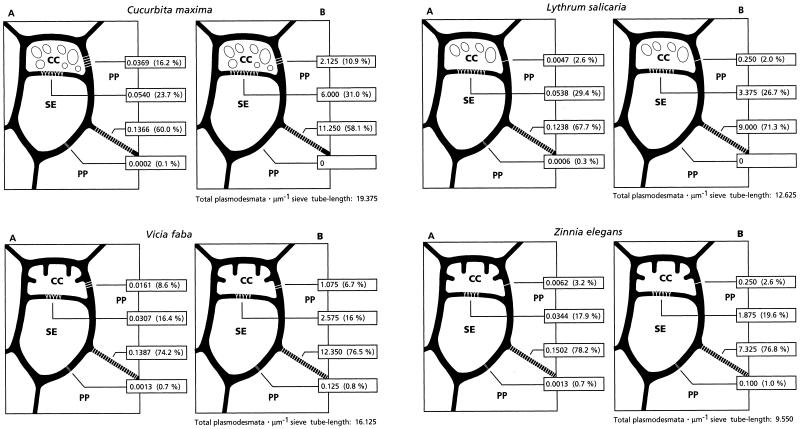
Figure 3.
Plasmodesmograms representing the plasmodesmal densities in the A plots (expressed as the number of plasmodesmata per micrometer of cell wall interface length). The B plots represent the plasmodesmal frequency (expressed as the total number of plasmodesmata per micrometer of sieve tube length). The two symplasmic species are located in the upper part of the figure and show fragmented vacuoles (or vesicles) in the CCs as a typical ultrastructural feature. The two apoplasmic species are in the lower part of the figure and have cell wall protrusions as a typical ultrastructural feature. The absolute numbers of plasmodesmata enable interspecific comparison of plasmodesmal occurrence at the respective interfaces. The proportional distributions (given as percentages in parentheses) are represented by the striping between the respective cell types and enable intraspecific comparison (Fisher, 1990; Botha and van Bel, 1992).

