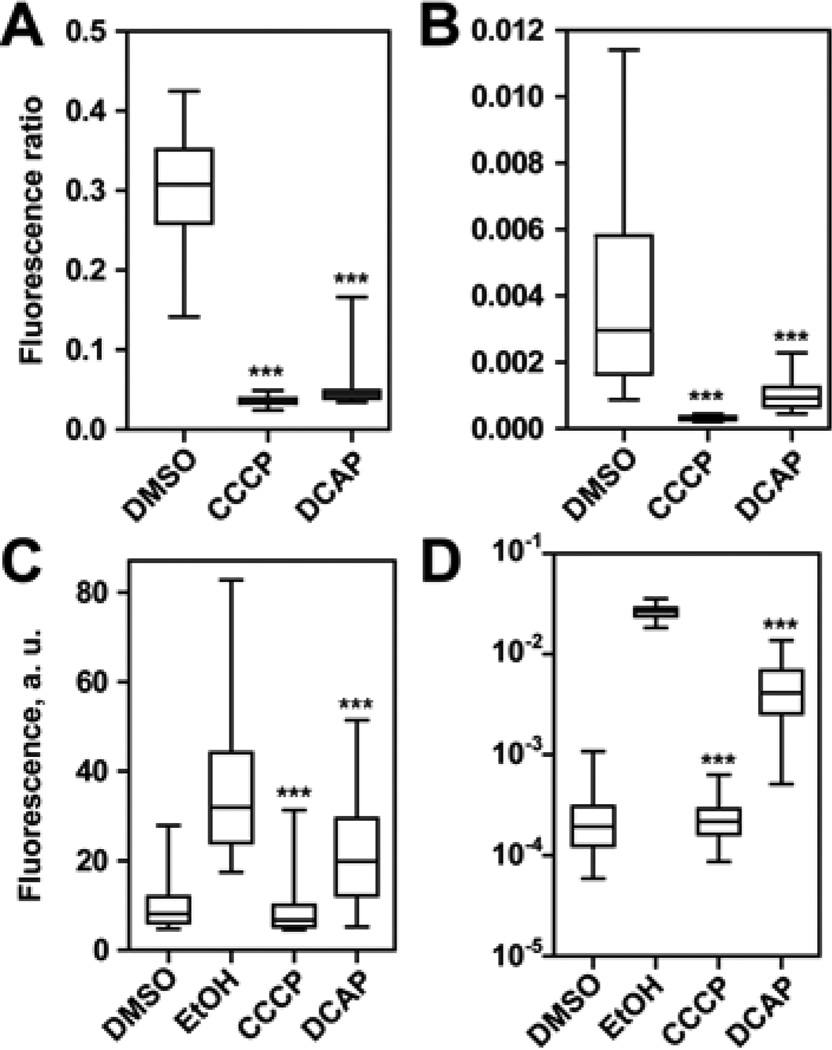
Figure 2.
(A, B) Measurement of ΔΨ using DiOC2. A) B. subtilis (n ≥ 8,964 cells). B) C. crescentus (n ≥ 158 cells). We calculated P-values by comparing data against the DMSO sample. (C, D) Measurement of membrane permeability using PI C) B. subtilis (n ≥ 2,546 cells). D) C. crescentus (n ≥ 35 cells). We calculated P-values by comparing data against the EtOH sample. In box plots, the top whisker represents 95%, the bottom whisker is 5%, the top of the box is 75%, the bottom of the box is 25%, and the line inside the box indicates the median of each sample population. Three asterisks (***) refers to p < 0.001.

