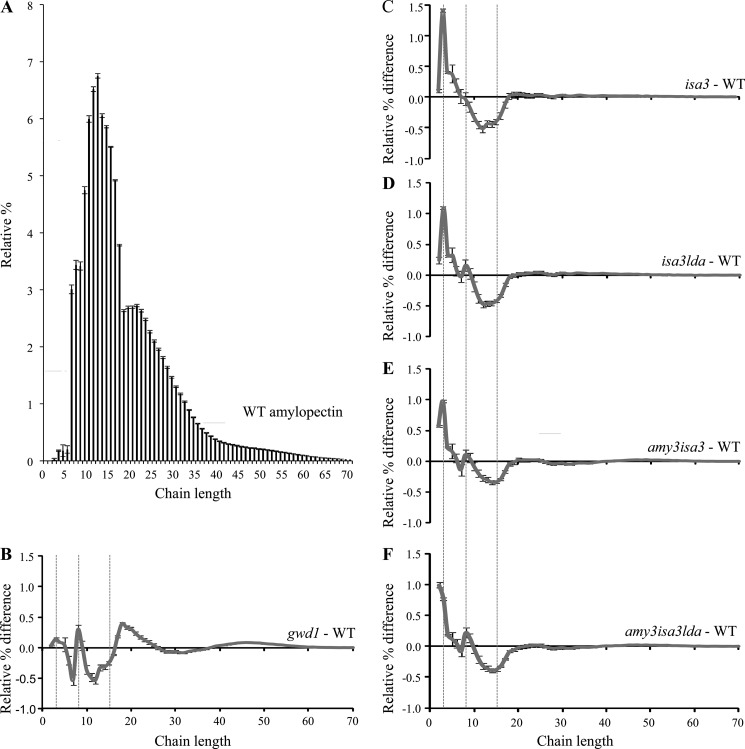
FIGURE 3.
Changes in amylopectin structure in starch excess mutants. Comparison of chain length distributions of starch from the wild type (WT), isa3, isa3lda, amy3isa3, amy3isa3lda, and gwd1. Starch was extracted from each of four replicate plants harvested at the end of the day. A, the chain length distribution of wild-type amylopectin. B–F, difference plots calculated by subtracting the relative percentages of wild-type amylopectin from those of gwd1 (B), isa3 (C), isa3lda (D), amy3isa3 (E), and amy3isa3lda (F). Chain lengths of d.p. 3, 8, and 15 are indicated by dashed lines. Errors in the difference plots (error bars) are calculated from the S.E. value of the wild type and the individual mutants, with consideration of error propagation (based on the error law of Gauss).

