FIGURE 3.
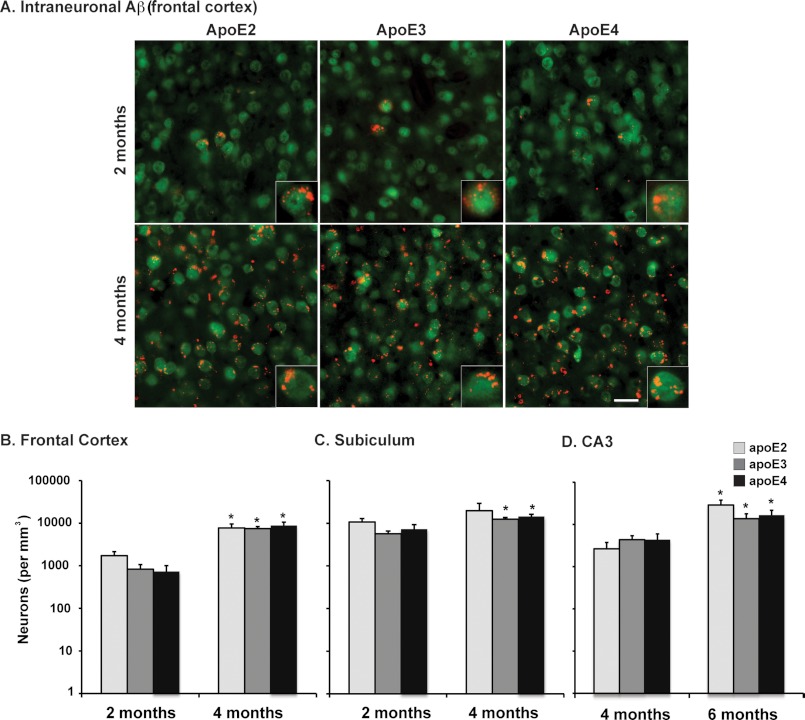
Intraneuronal Aβ levels are comparable among the APOE genotypes. A, representative images of cortex in sagittal brain sections from 2- and 4-month-old EFAD mice immunostained for Aβ (red) and NeuN (green), ×20 magnification (scale bar = 20 μm). Shown are total numbers of Aβ-containing neurons in the frontal cortex (B) at 2 and 4 months; in the subiculum (C) at 2 and 4 months; and in the CA3 region (D) at 4 and 6 months in EFAD mice counted via unbiased stereology. Data are expressed as mean ± S.E. and were analyzed by two-way ANOVA followed by Bonferroni's multiple comparison post hoc analysis. *, p < 0.05 versus 2 or 4 months.

