FIGURE 2.
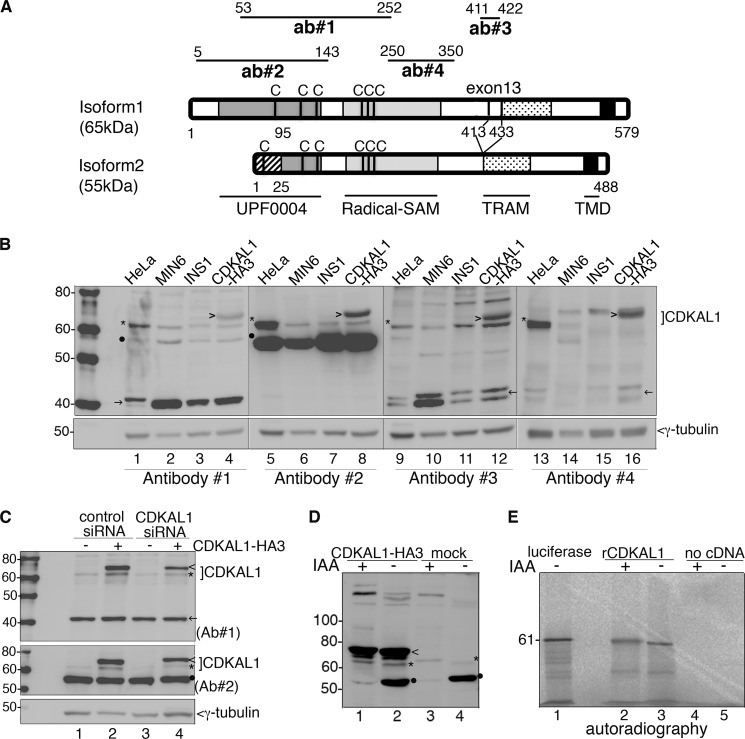
Specificity of anti-CDKAL1 antibodies. A, schematic representation of CDKAL1 recombinant fragments used to generate the four antibodies tested. The numbers on line edges correspond to amino acid positions in isoform 1. Notably, Ab3 (ab#3) can only recognize isoform 1 due to the lack of exon13 (coding residues 413–433) in isoform 2. The position of Cys (C) residues forming the two 4Fe-4S clusters, which are essentials for CDKAL1 enzymatic activity, is indicated for both isoforms. Protein domains are named at the bottom of the panel. B, immunoblot analysis of protein extracts from different cell lines and from CDKAL1-HA3-transfected INS-1 cells. Four different anti-CDKAL1 antibodies are compared. Endogenous CDKAL1 band is marked with *, CDKAL1-HA3 with >, the 55-kDa, and the 40-kDa proteins with ● and →, respectively. γ-Tubulin was used as a loading control. C, INS-1 cells transfected with control or CDKAL1-siRNA oligos (oligo1 + oligo2), combined with CDKAL1-HA3 or empty plasmid transfection, were analyzed by immunoblotting with anti-CDKAL1 Ab1 and Ab2 (Ab#1 and Ab#2) and shown in the upper or middle panel, respectively. Endogenous CDKAL1 is marked with * and CDKAL1-HA3 with >. Note that both 40-kDa (←) and 55-kDa (●) proteins, recognized by Ab1 and Ab2 (Ab#1 and Ab#2), respectively, are unaffected by CDKAL1 siRNA. γ-Tubulin was used as a loading control. D, cell extracts of INS-1 cells transfected with CDKAL1-HA3, or with empty plasmid, were subjected to IAA treatment, analyzed by SDS-PAGE. and immunoblotted with anti-CDKAL1#2. Endogenous CDKAL1 is marked with *, CDKAL1-HA3 with <, and the 55-kDa protein with ●. E, autoradiographic detection of samples ± IAA treatment after in vitro synthesis with [35S]Met. Control reactions without cDNA were analyzed in parallel. As a size indicator, luciferase cDNA was translated and analyzed in parallel by SDS-PAGE.

