FIGURE 8.
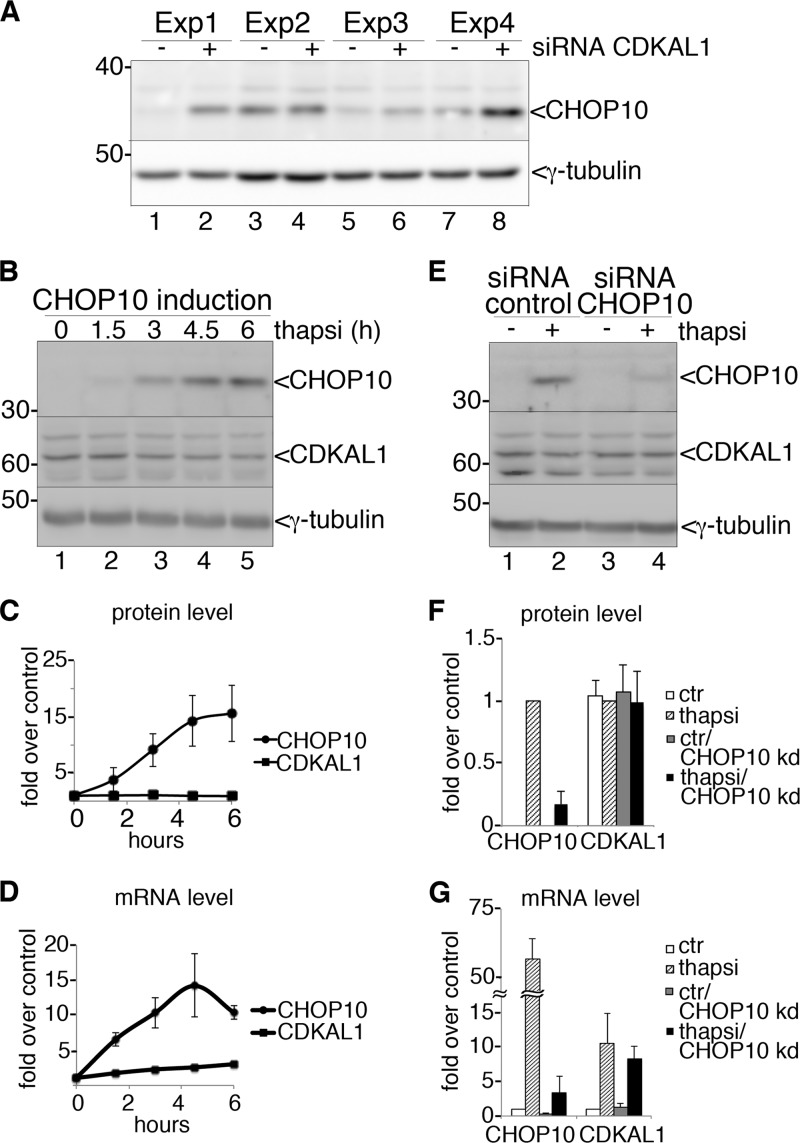
CDKAL1 and the unfolded protein response. A, immunoblot analysis of INS-1 cell extracts, after CDKAL1-siRNA or control-siRNA transfection, with anti-CHOP antibody. γ-Tubulin was used as a loading control. Four independent experiments are shown. B, INS-1 cells treated with 1 μm thapsigargin were harvested at different time points and analyzed by SDS-PAGE and immunoblot with anti-CHOP10 antibody and anti-CDKAL1 Ab1. γ-Tubulin was used as a loading control. C, quantification of Western blots as in A for CHOP10 and CDKAL1 from three independent experiments. Pixel intensity values for the two proteins at time point 0 equal 1. D, quantitative RT-PCR for mRNA levels of CHOP10 and CDKAL1 in cells treated as in A. Values for mRNA levels at time point 0 equal 1. n = 3. E, CHOP10 knockdown. INS-1 cells were transfected with CHOP10-siRNA or control-siRNA. 48 h after transfection, cells were treated for 4.5 h with 1 μm thapsigargin, or DMSO, to induce CHOP10 expression. Cells extracts were analyzed by SDS-PAGE and immunoblot with anti-CHOP10 antibody and CDKAL1 Ab1. γ-Tubulin was used as loading control. F, quantification of Western blots as in E for CHOP10 and CDKAL1 from three independent experiments. The white bar corresponds to lane 1 in E, the dotted bar to lane 2, the gray bar to lane 3, and the black bar to lane 4. Pixel intensity values for the two proteins as in lane 2 equal 1. G, quantitative RT-PCR for mRNA levels of CHOP10 and CDKAL1 in cells treated as in E. Values for mRNA level with control-siRNA and DMSO treatment equal 1. n = 3.

