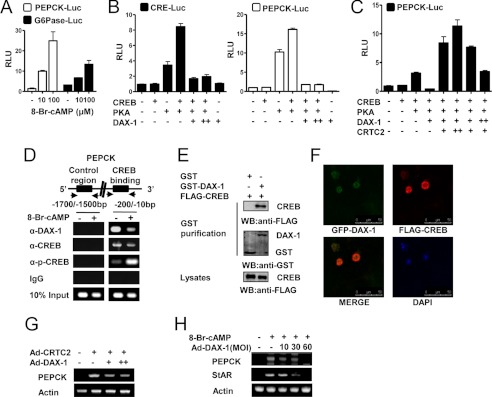
FIGURE 2.
DAX-1 represses cAMP-induced PEPCK gene expression in Leydig cells. A, MA-10 cells were transfected with PEPCK-Luc (200 ng) and Glc-6-Pase-Luc (200 ng), respectively. Twenty four hours after the transfection, MA-10 cells were cultured in 0.5% charcoal-stripped horse serum and glucose-free medium supplemented with 20 mmol/liter sodium lactate, 1 mmol/liter sodium pyruvate, and 15 mmol/liter HEPES, followed by cAMP treatment at the indicated concentrations for 12 h. Experiments were performed in triplicate, and data are expressed in relative luciferase units (RLU) and as the fold activation relative to the control, representing mean ± S.D. of three individual experiments. B, cells were transfected with CRE-Luc (200 ng), PEPCK-Luc (200 ng), CREB (200 ng), PKA (200 ng), and DAX-1 (200 ng) as indicated. Experiments were performed in triplicate, and data are expressed in relative luciferase units (RLU) and as the fold activation relative to the control. Data represent mean ± S.D. of three individual experiments. C, MA-10 cells were transfected with PEPCK-Luc (200 ng), CREB (200 ng), PKA (200 ng), DAX-1 (200 ng), and CRTC2 (200 ng) as indicated. Experiments were performed in triplicate, and data are expressed in RLU and as the fold activation relative to the control. Data represent mean ± S.D. of three individual experiments. D, MA-10 cells were serum-starved for 12 h followed by cAMP (100 μm) for 12 h. Soluble chromatin was prepared and immunoprecipitated with antibodies against DAX-1, CREB, p-CREB, or IgG only as indicated. Soluble chromatin (10%) was used as input. PCR was performed to determine and quantify CREB binding to the endogenous PEPCK promoter. E, 293T cells were cotransfected with FLAG-CREB expression vectors together with GST DAX-1 (pEBG-DAX-1) or GST alone (pEBG) as a control. The complex formation (top panels, GST purification) and FLAG-CREB (5 μg) used for the in vivo binding assay (bottom panel, lysate) were determined by anti-FLAG antibody immunoblot (WB). The same blot was stripped and reprobed with an anti-GST antibody (middle panel) to confirm the expression levels of the GST fusion protein (GST-DAX-1) and the GST control (GST). F, HeLa cells were transiently transfected with pEGFP-DAX-1 and pCDNA3/FLAG-CREB. The yellow stain in the merged image depicts colocalization of DAX-1 and CREB (×400). Data shown are representative cells from one of three independent experiments. DAPI, 4′,6-diamidino-2-phenylindole dihydrochloride. G, MA-10 cells were infected with the CRTC2 (30 m.o.i.) and DAX-1 (10, 30 m.o.i.) adenoviruses. Total RNA was isolated for semiquantitative RT-PCR analysis. Data represent mean ± S.D. of three individual experiments. H, MA-10 cells were infected with DAX-1 adenovirus at an m.o.i. (MOI) of 10, 30, or 60 for 24 h followed by cAMP (100 μm) treatment for 12 h. Total RNA was isolated for semiquantitative RT-PCR analysis. Data represent mean ± S.D. of three individual experiments.

