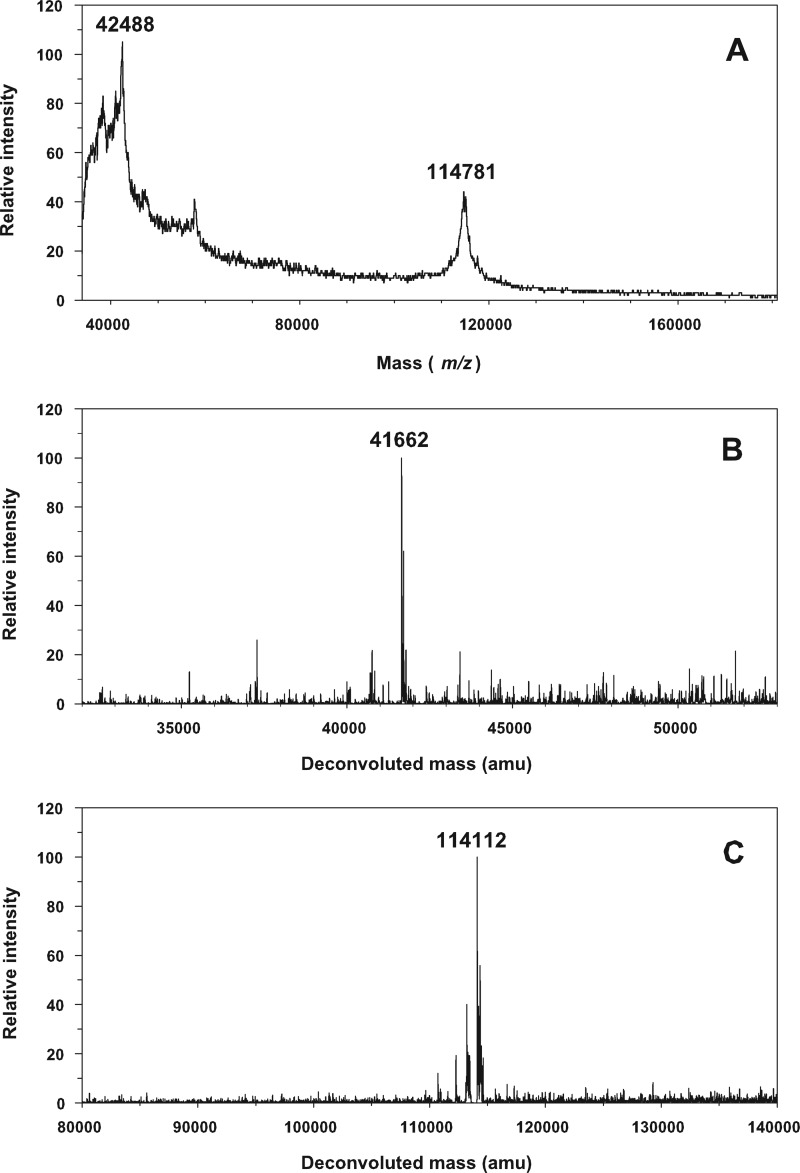
FIGURE 2.
Mass spectroscopy of H+,K+-ATPase. A, MALDI-TOF spectrum providing molecular masses of 42,488 Da and 114,781 Da, corresponding to the glycosylated β-subunit and to the α-subunit. B and C, LC/ESI-TOF-MS spectra providing molecular masses of 41,662 Da, corresponding to the glycosylated β-subunit (B), and of 114,112 Da, corresponding to the α-subunit (C). m/z, mass/charge ratio. amu, atomic mass units.

