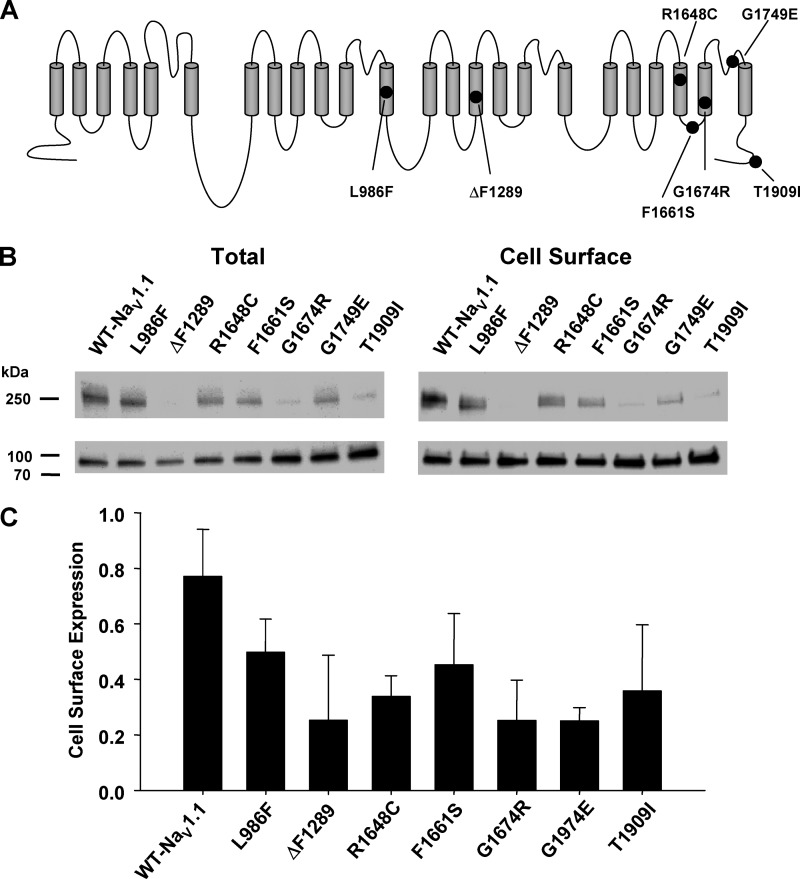
FIGURE 1.
SMEI-associated NaV1.1 mutants exhibit reduced cell surface expression. A, topology diagram of NaV1.1 illustrating the location of SMEI-associated mutations. B, cell surface biotinylation was used to examine plasma membrane expression of WT-NaV1.1, L986F, ΔF1289, R1648C, F1661S, G1674R, G1749E, and T1909I in transiently transfected cells. Representative immunoblots of total protein (left) and biotinylated cell surface protein (right) are illustrated. The lower panel in each blot is the transferrin loading control. C, semiquantitative analysis of cell surface protein expressed as a ratio of recovered biotinylated protein to total protein. Data are expressed as mean ± S.E. for 6 replicates.

