
FIGURE 3.
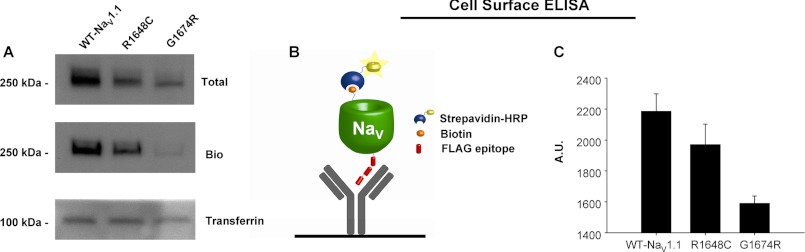
Quantitative analysis of cell surface expression. A, total and cell surface protein expression of WT-NaV1.1, R1648C, and G1674R detected by Western blot analysis. Proteins were detected with antibodies directed against the FLAG epitope. Cell surface protein was probed following cell surface biotinylation (Bio) and recovery of biotinylated proteins by streptavidin affinity chromatography. Detection of the endogenous protein transferrin was done to demonstrate equal protein loading in each lane. B, graphic representing cell surface ELISA showing immobilized anti-FLAG antibody and antibody bound to FLAG-tagged NaV channel that has been biotinylated and conjugated to streptavidin-HRP. C, average cell surface ELISA data showing relative expression of WT-NaV1.1, R1648C, and G1674R. Data are expressed as mean ± S.E. for 6 replicates. A. U., absorbance units.