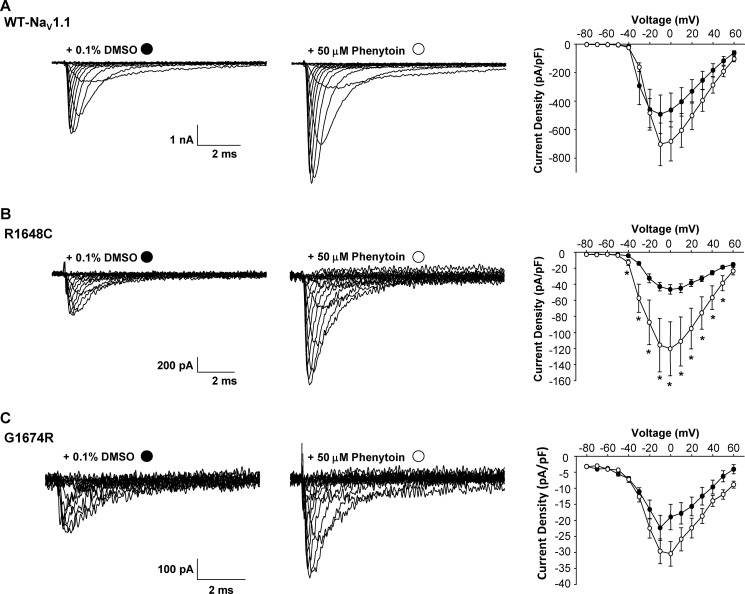
FIGURE 5.
Phenytoin rescues NaV1.1 channel function. A–C, representative whole-cell currents recorded from cells stably expressing WT-NaV1.1 (A), R1648C (B), or G1674R (C) grown in the presence of 0.1% DMSO (left) or 50 μm phenytoin (middle). The right panel represents the average current voltage relationship for cells grown in the presence of either 0.1% DMSO (filled circles) or 50 μm phenytoin (open circles). Data are expressed as mean ± S.E. for 8–18 replicates. An asterisk indicates p < 0.05 when compared with DMSO-treated cells. pF, picofarads.

