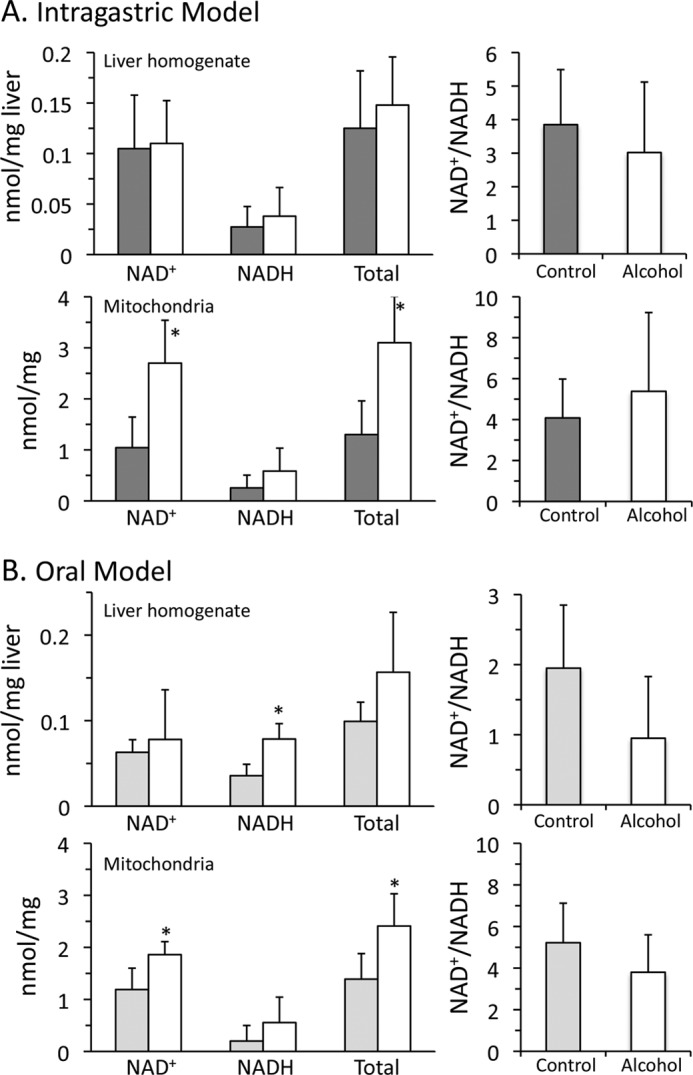
FIGURE 4.

Effects of alcohol feeding on NAD+-NADH levels and redox status in liver homogenate and mitochondria. A, intragastric alcohol model. B, oral alcohol model. Solid bars, control; empty bars, alcohol treatment. Mice were fed alcohol intragastrically or orally, and liver mitochondria were isolated using a Percoll gradient or differential centrifugation. NAD+ and NADH levels were measured by HPLC with the fluorescence detector. NAD+-NADH levels in liver homogenate are expressed as nmol/mg liver wet weight, whereas mitochondrial NAD+-NADH levels are expressed as nmol/mg of protein. n = 4–5 mice/group. Results are mean ± S.D. (error bars); *, p < 0.05 versus control.
