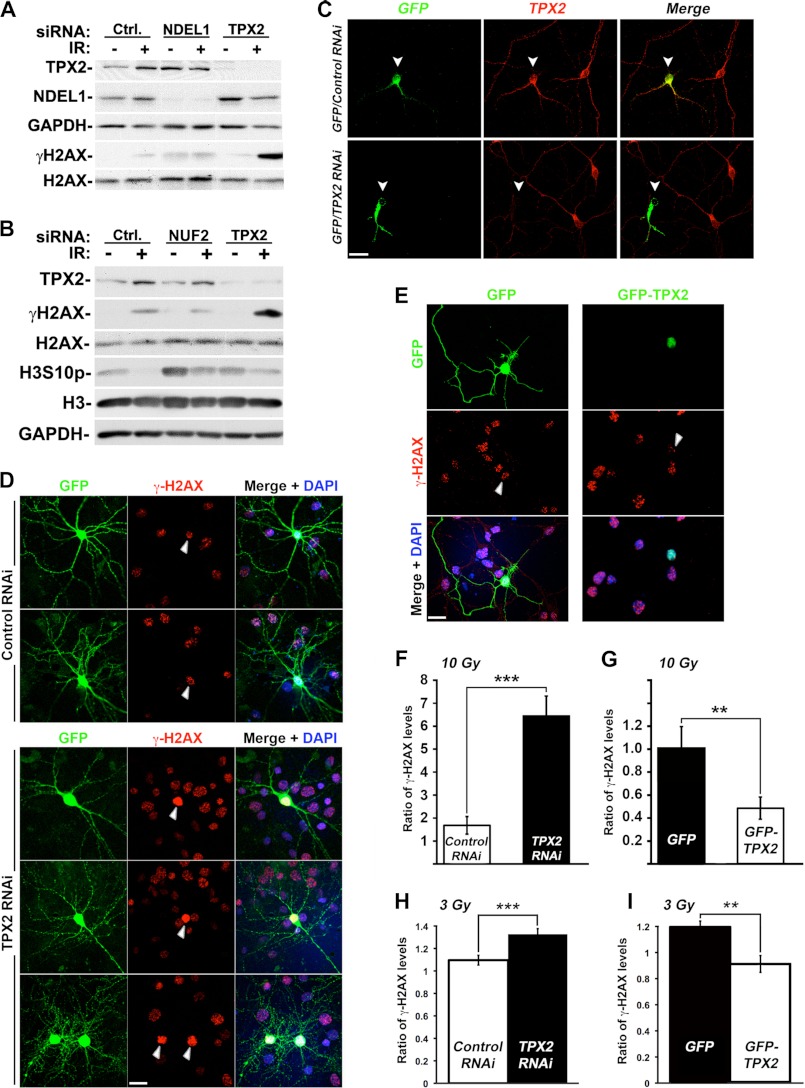
FIGURE 5.
Regulation of γ-H2AX levels by TPX2 is distinct from its mitotic functions and occurs in postmitotic G0 primary neurons. A, depletion of Ndel1 does not increase γ-H2AX levels after ionizing radiation treatment. B, depletion of NUF2 does not increase γ-H2AX levels after ionizing radiation treatment. The mitotic arrest upon NUF2 depletion was confirmed with the increased levels of the mitotic marker H3S10p (see text for details). C, significant decrease in TPX2 levels in mouse primary cortical neurons co-transfected with a TPX2 shRNA-encoding construct and GFP (ratio, 5:1) as detected by immunofluorescence and confocal microscopy using commercially available TPX2 antibody 184. See supplemental Fig. 5 for the expression pattern of TPX2 in brain tissues, cellular distribution of TPX2 in primary neurons, and specificity of the TPX2 shRNA and antibody 184. D, enhanced levels of γ-H2AX in G0 postmitotic primary neurons co-transfected with vectors encoding TPX2 shRNA and GFP (ratio, 10:1) 1 h after 10 Gy compared with surrounding untransfected cells or cells co-transfected with vectors encoding a control shRNA and GFP (ratio, 10:1) as determined by immunofluorescence and confocal microscopy. E, decreased levels of γ-H2AX in G0 postmitotic primary neurons transfected with GFP-TPX2 compared with surrounding untransfected cells or cells transfected with GFP 1 h after 10 Gy as determined by immunofluorescence and confocal microscopy. Note that the γ-H2AX signals in control shRNA- and GFP-expressing neurons are of an intensity similar to that of untransfected surrounding cells. F and G, quantification of the relative changes in γ-H2AX signals in neurons in D and E expressed by the average ratio of total nuclear γ-H2AX signals of transfected neurons/average total nuclear γ-H2AX signals of non-transfected surrounding cells. F, ratio control shRNA (n = 10)/non-transfected (n = 196) = 1.7 ± 0.4 (S.E.) versus ratio TPX2 shRNA (n = 16)/non-transfected (n = 459) = 6.4 ± 0.9 (S.E.); p < 0.001, unpaired t test. G, ratio GFP (n = 9)/non-transfected (n = 37) = 1.0 ± 0.1 (S.E.) versus ratio GFP-TPX2 (n = 8)/non-transfected (n = 33) = 0.5 ± 0.1 (S.E.); p < 0.001, unpaired t test. H and I, quantification of the relative changes in γ-H2AX immunofluorescence signals in neurons co-transfected with vectors encoding a control or TPX2 shRNA and GFP (ratio, 10:1) (H) or a GFP or GFP-TPX2 construct (I) 1 h after 3 Gy. H, ratio control shRNA (n = 58)/non-transfected (n = 300) = 1.1 ± 0.1 (S.E.) versus ratio TPX2 shRNA (n = 75)/non-transfected (n = 330) = 1.3 ± 0.1 (S.E.); p < 0.001, unpaired t test. I, ratio GFP (n = 50)/non-transfected (n = 297) = 1.2 ± 0.1 (S.E.) versus ratio GFP-TPX2 (n = 47)/non-transfected (n = 420) = 0.9 ± 0.1 (S.E.); p < 0.01, unpaired t test. Values were calculated as in F and G. NS, non-significant; **, p < 0.01; ***, p < 0.001. Error bars represent S.E. Bars, 20 μm. Ctrl., control. White arrows indicate transfected cells (C–E).

