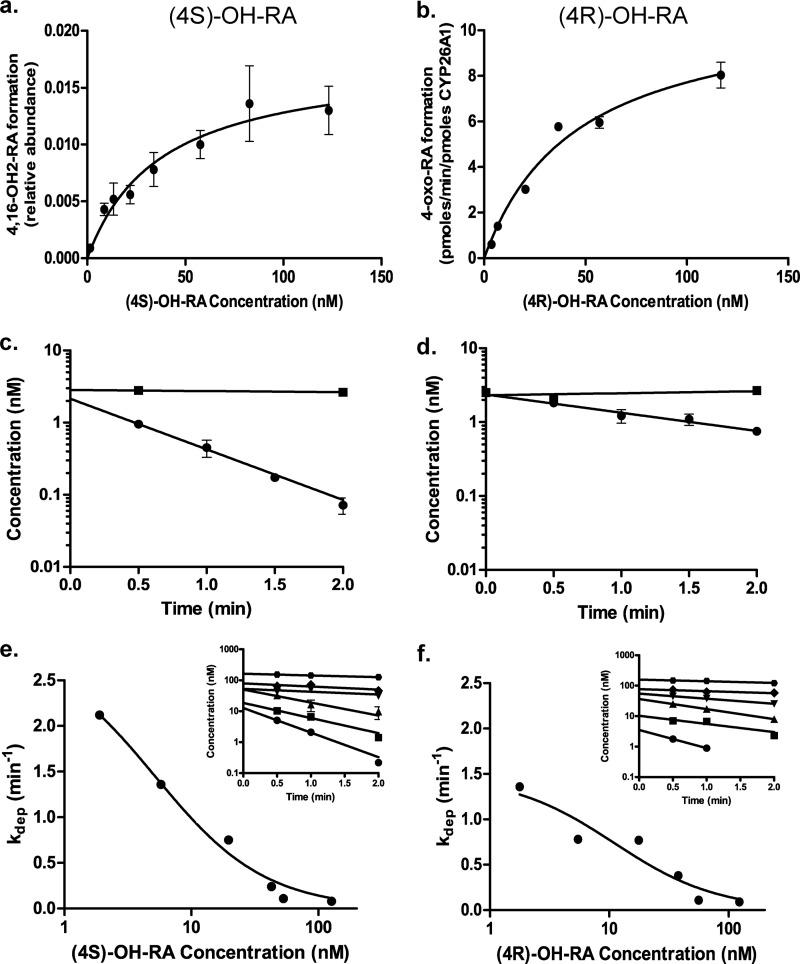
FIGURE 5.
Metabolism of (4S)-OH-RA (left panel) and (4R)-OH-RA (right panel) by CYP26A1. The formation of specific metabolites was measured using (4S)-OH-RA (panel a) and (4R)-OH-RA (panel b) as substrates, and the Km value was determined according to Equation 2. The relative formation rate of 4,16-OH2-RA was quantified from the peak height ratio, whereas 4-oxo-RA formation was quantified using a standard curve. Error bars show the S.D. of triplicate measurements for each point. Panels c and d show the depletion of (4S)-OH-RA and (4R)-OH-RA by CYP26A1 at 2.5 nm initial concentration (closed circles). The closed squares show the depletion of 4OH-RA enantiomers in no-enzyme control incubations. No NADPH controls were also done and they were identical to the no-enzyme controls (not shown). Error bars show the S.D. of triplicate incubations. Representative determinations of the concentration-dependent depletion of (4S)-OH-RA and (4R)-OH-RA by CYP26A1 are shown in panels e and f, respectively. The depletion rates were measured at six different concentrations and the depletion rate constants were determined (insets in panels e and f). All depletion experiments were conducted on multiple days and in triplicate on each day. S.D. for the individual measurements are shown by error bars. Equation 1 was fitted to the data of depletion constants as a function of 4-OH-RA concentration to determine the Km and kdep,max of (4S)-OH-RA and (4R)-OH-RA depletion by CYP26A1. The kinetic values for (4S)-OH-RA were Km = 5.2 ± 1.3 nm and kdep,max = 2.9 ± 0.3 min−1. For (4R)-OH-RA the values were Km = 11.0 ± 5.2 nm and kdep,max = 1.5 ± 0.2 min−1.

