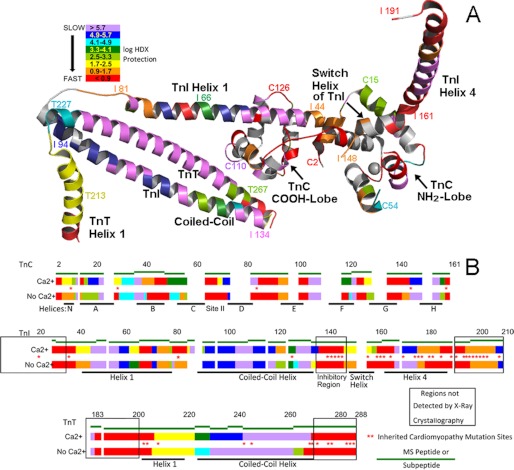
FIGURE 5.
Dynamic maps of cardiac troponin in the absence and presence of site II Ca2+. Shown is a summary of all of the results, using a logarithmic scale to convey the wide range of observed dynamic behavior. A and B show the same color coding. Red, highly dynamic unprotected regions, generally undergoing HDX in <5 s. Violet, highly stable regions that have slow dynamics. Intermediate dynamics are shown according to the degree of protection from HDX, which was calculated from the measured HDX rates (Table 1). A, CBMII troponin (Ca2+-free) findings mapped onto the cardiac troponin three-dimensional structure. Residue number annotation sites were chosen for ease of illustration. Orientation is the same as in Figs. 1–4. In B, the same CBMII troponin data (indicated by No Ca2+) as well as data for unmodified troponin (indicated by Ca2+) are shown mapped onto the linear amino acid sequence positions within each troponin subunit. Green line segments indicate the examined peptides or subpeptides, providing a lower limit (i.e. maximum error) to the spatial resolution of the assignments. Within each green line segment, the Ca2+ dynamic regions are positioned to minimize the differences from the No Ca2+ map. Asterisks indicate sites of cardiomyopathy-inducing missense mutations. Note that they cluster almost entirely within the more dynamic regions of troponin and that many sites are Ca2+-sensitive.

