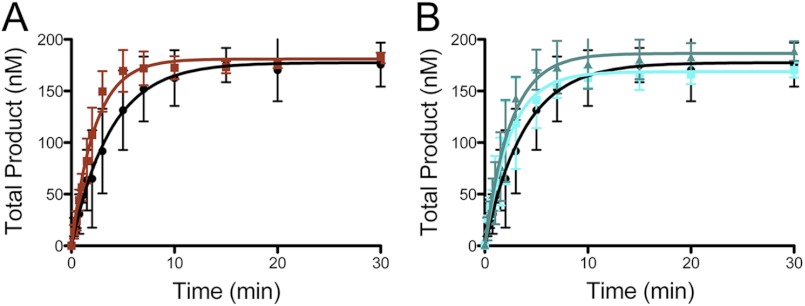
FIGURE 4.
The isolated exonuclease and RQC domains of WRN stimulate hpol η1–437 activity. A, DNA synthesis by hpol η1–437 (2 nm) was monitored over time in the presence of the 100 nm (■) WRN1–333 exonuclease domain. The no WRN control experiment (●) from Fig. 1 was re-plotted for comparison. Formation of total product is shown. The single turnover results for each experiment were fit to a single exponential equation to yield the following kinetic parameters: WRN1–333 (■): A = 181 ± 3 nm, kobs = 0.44 ± 0.03 min−1. B, DNA synthesis by hpol η1–437 (2 nm) was monitored over time in the presence of 100 nm (■) and 1 μm (▴) WRN949–1078 RQC domain. The no WRN control experiment (●) from Fig. 1 was re-plotted for comparison. Formation of the total product is shown. The single turnover results for each experiment were fit to a single exponential equation to yield the following kinetic parameters: WRN949–1078 (■): A = 169 ± 5 nm, kobs = 0.41 ± 0.04 min−1; WRN949–1078 (▴): A = 186 ± 5 nm and kobs = 0.40 ± 0.04 min−1.

