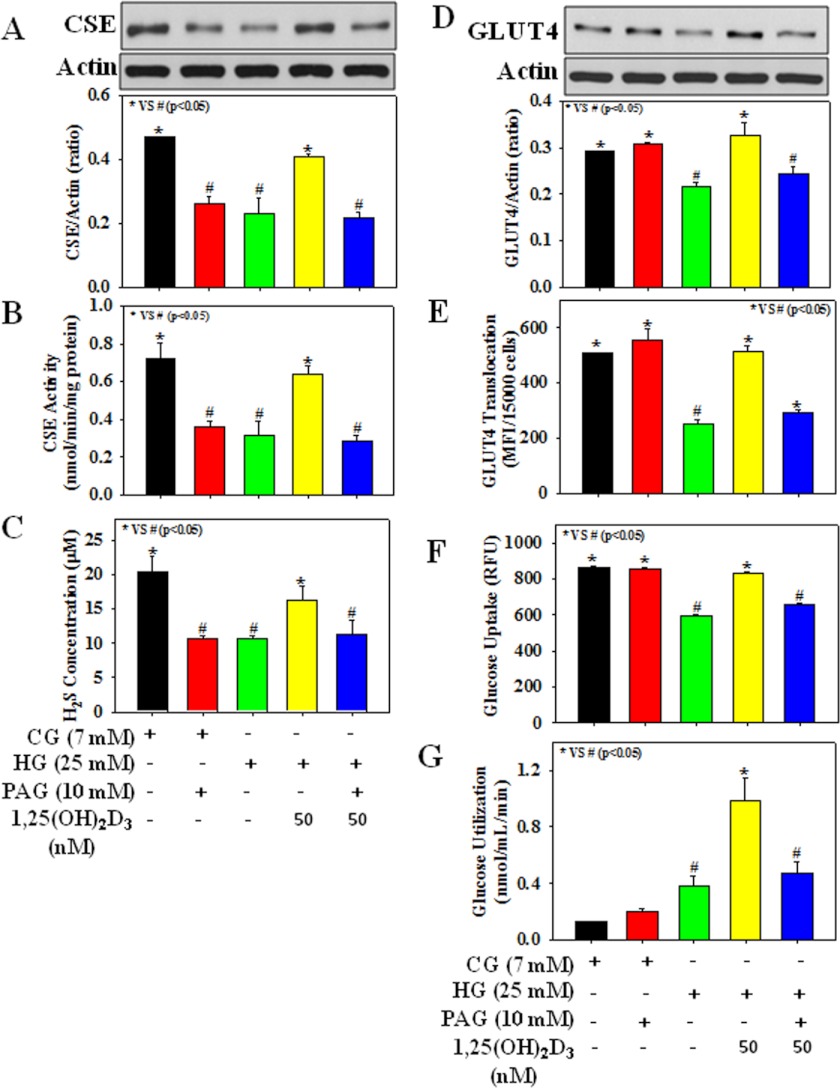
FIGURE 2.
Effect of PAG on CSE protein expression and its activity, H2S formation, GLUT4 total protein expression and its translocation, and glucose uptake and glucose utilization in 3T3L1 adipocytes exposed to 1,25(OH)2D3 and CG or HG. A, CSE protein expression. B, CSE activity. C, H2S formation. D, GLUT4 total protein expression. E, GLUT4 translocation. F, glucose uptake. G, glucose utilization. Cells were treated with PAG (10 mm) 5 min prior to 1,25(OH)2D3 (50 nm) supplementation followed by CG (7 mm) or HG (25 mm) exposure for the next 20 h. Values are mean ± S.E. (error bars; n = 3).

