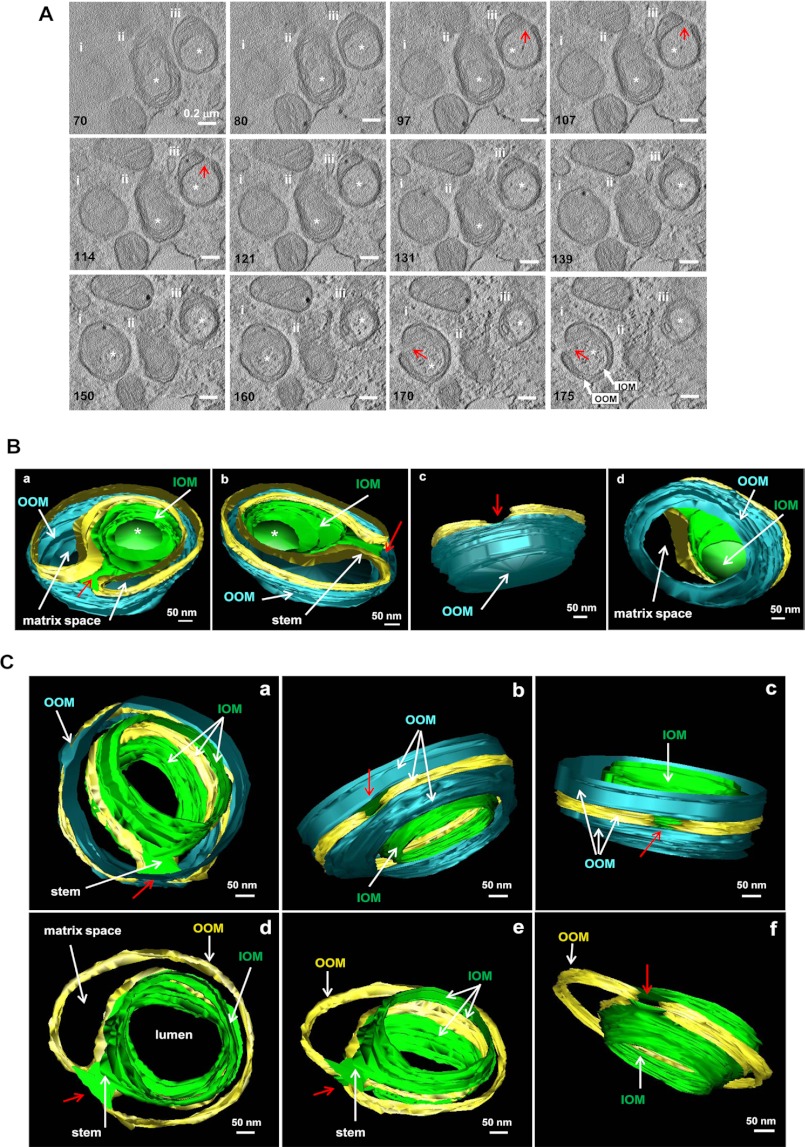
FIGURE 3.
Electron tomography of mitochondrial spheroids. MEFs treated with CCCP for 6 h were fixed and subjected to electron tomography. The topographic slices (A) illustrate three mitochondrial spheroids (i, ii, and iii), from which the three-dimensional models of spheroids i (B) and iii (C) were reconstructed. Images were extracted from supplemental Videos 1–3. Only the outer membrane was traced and modeled. The numbers in A represent those of slices along the z axis of the original volume. The lumen of the spheroid (indicated by an asterisk in A) was delimited by the inside outer membranes (IOM, green) and opened to the cytoplasm through an orifice (red arrows). The outside outer membrane (OOM, cyan) was the same OM that extended to the IOM, and the relationship is indicated by the gold-colored strip. IOM and OOM were linked by a membranous stem that embedded the orifice (C). Between IOM and OOM were the inner membranes (not depicted in the model) and the matrix space (indicated, B and C). The model in B also showed that the spheroid and its internal lumen were completely delimited at one end that was preserved in this volume. Removal of the OOM at this end allowed the visualization of the delimited lumen from the matrix side (Bd). The model in C also illustrates the connection of the lumen to the cytoplasm by the orifice, which was embedded in a membranous stem. Part of the OOM was removed for a clearer view (C, d–f).

