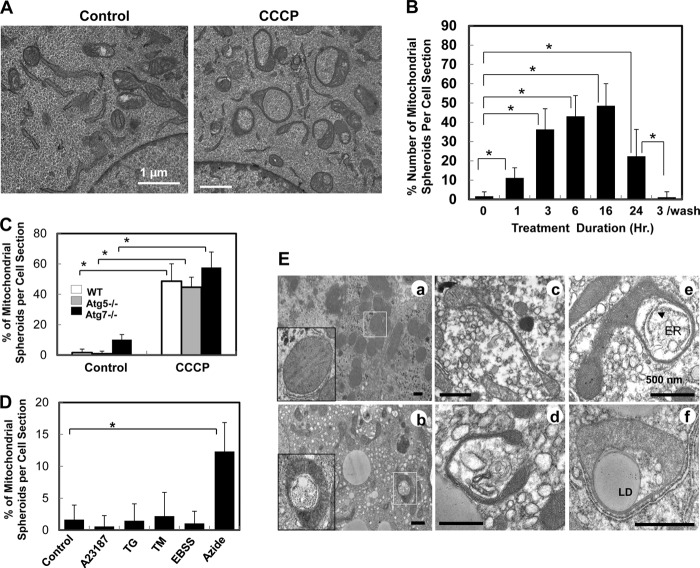
FIGURE 1.
Formation of mitochondrial spheroids in oxidative stress. A, wild-type MEFs were treated with vehicle control or CCCP for 6 h followed by EM. B, the percentage of mitochondrial spheroids in all mitochondrial structures was determined in each cell section at different times after CCCP treatment. The washout experiment was conducted with a 3-hour treatment, followed by replacement with new medium and continuous culture for another 21 h (a total of 24 h of culture). C, the percentage of mitochondrial spheroids was determined in MEFs of different genotypes treated with CCCP for 6 h. D, wild-type MEFs were treated with A23187 (2.5 μm), thapsigargin (TG) (0.5 μm), or tunicamycin (TM) (2.5 μm) for 6 h; subjected to Earle's Balanced Salt Soultion (EBSS) for 2 h; or treated with sodium azide (10 μm) for 6 h followed by EM. Mitochondrial spheroid formation was quantified as in A. E, C57BL/6 mice were treated with saline (a) or APAP (b–f) for 6 h. EM examination of livers showed multiple examples of mitochondrial spheroids with a narrowing segment and engulfing cytosolic components including the endoplasmic reticulum (ER) (e), lipid droplets (LD, f) and other membranes (d) in APAP treatment. *, p < 0.05.

