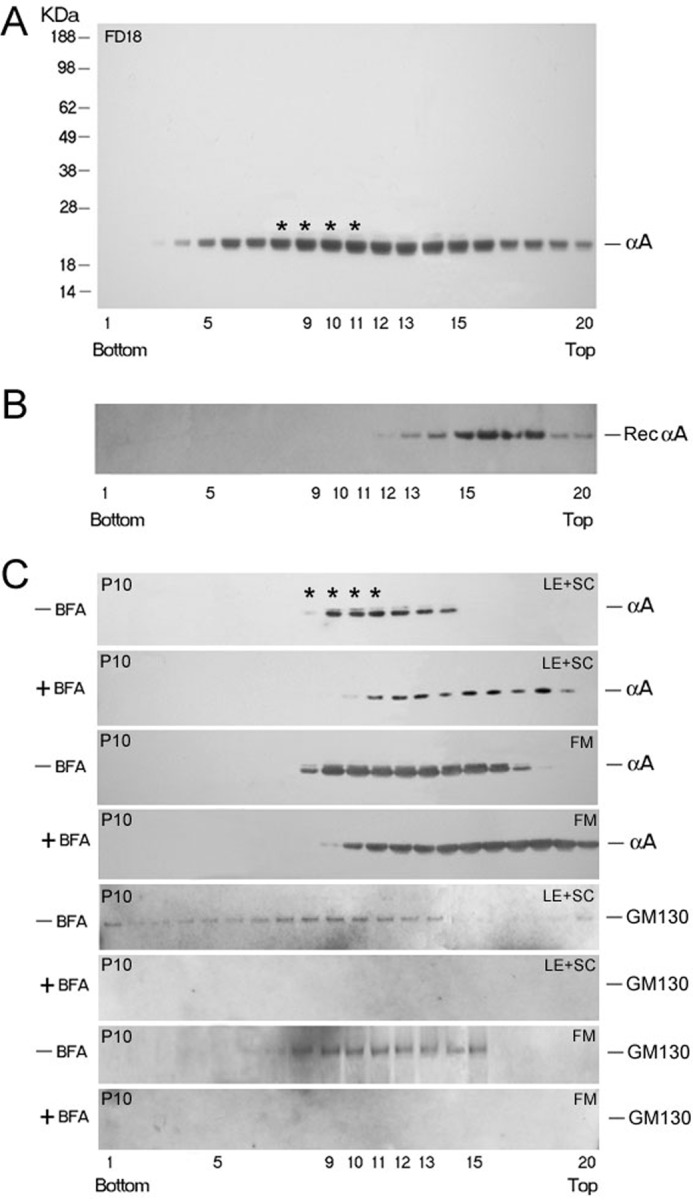
FIGURE 4.

Discontinuous sucrose density gradient fractionation for analyses of Golgi-enriched membranes. A, distribution of αA (as detected by immunoblotting) in the gradient run with post-nuclear homogenate of whole FD18 rat lens (5.36 mg total protein). αA is distributed broadly, from the bottom (fraction 3) all through to the top of the gradient. Asterisks indicate the position of the Golgi enriched membrane fraction as determined by Golgi intrinsic membrane protein GM130 location (14, 15). The presence of αA in fractions 3–5, close to bottom (1.3 m sucrose) and in fractions 5–12 suggest that αA is associated with heterogeneous membrane components. B, purified recombinant αA (50 μg) was run in a separate gradient under similar conditions (Rec αA panel) as a control. C, sucrose gradient fractionation of post nuclear homogenates made from dissected lens epithelium + superficial cortex (LE+SC) and FM of P10 rat lenses. Lenses were incubated with +BFA for 90 min before fractionation. Note that αA associated with the Golgi in fractions 8–11 is susceptible to BFA treatment. The pattern shifts toward the top of the gradient (C, +BFA panels) because of the disorganization of the Golgi. Note that we could not detect any GM130 reactivity in the lens epithelium + superficial cortex (LE+SC) and FM in + BFA panels (bottom panel and third panel from bottom).
