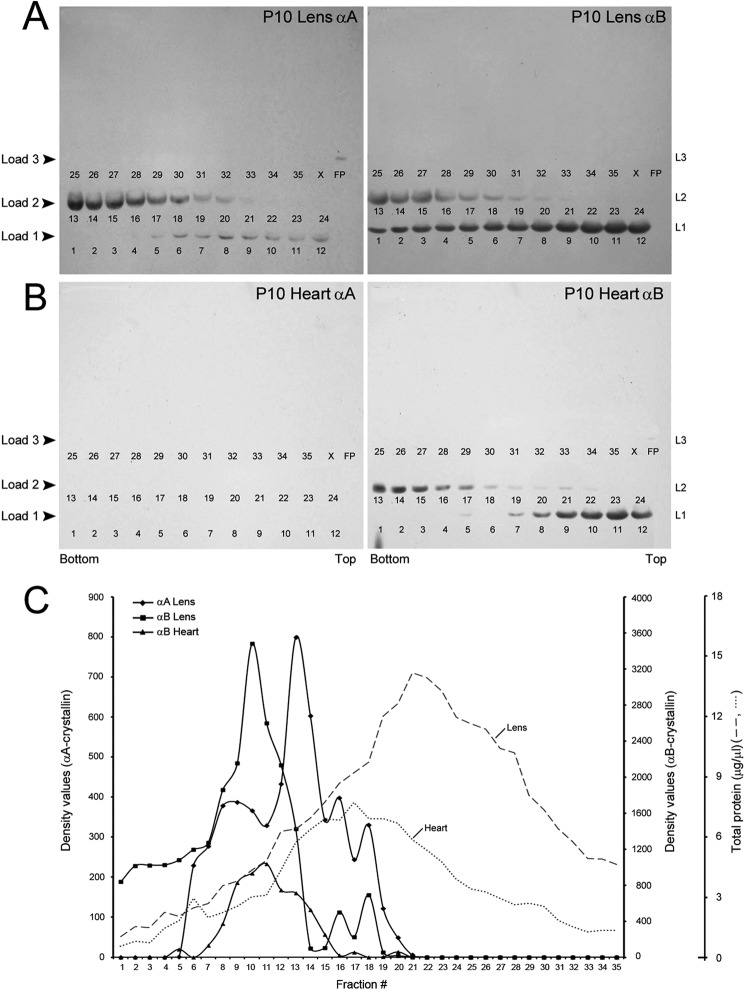
FIGURE 7.
αA and αB fractionate with smooth membranes and rough endoplasmic reticulum, respectively. Sucrose gradients similar to that shown in Fig. 6 were run with P10 heart and P10 lens post mitochondrial homogenates. Smaller volume fractions (35 fractions as opposed to 20 in Figs. 5 and 6) were collected from the bottom of the gradient. All 35 fractions were electrophoresed on a single SDS-PAGE gel and immunoblotted (see “Experimental Procedures”). We did this by multiple loadings into each well (thus each lane was loaded three times, 8–12 min apart); first, fractions 1–12, then 13–24, and finally 25–35 on the same gel. Four such gels were run (two from the heart and two from the lens) and immunoblotted. The numbers in each panel (1–35) represent the gradient fractions on each gel. These numbers are underneath the immunoreaction in each lane. Note that no reactions are seen in fractions 22–35 in all immunoblots. A, P10 lens immunoblots are shown (P10 lens αA and P10 lens αB). B, P10 heart immunoblots are shown (P10 heart αA and P10 heart αB). C, plots of the densitometer scans (arbitrary units) of the immunoblots obtained with anti-αA and anti-αB in the lens and in the heart shown in B. Dotted and dashed gray lines show total protein distribution in the heart and lens gradients. αB in the lens (panel P10 lens αB) and the heart (panel P10 heart αB) fractionates with rough ER. There is no αA in the heart (panel P10 heart αA), and therefore, there are no bands in this immunoblot. In the lens, αA fractionates with smooth membranes. X, blank lane; FP, free polysome pellet. L1, L2, and L3 refer to three loads (L1–L3, see “Experimental Procedures”).

