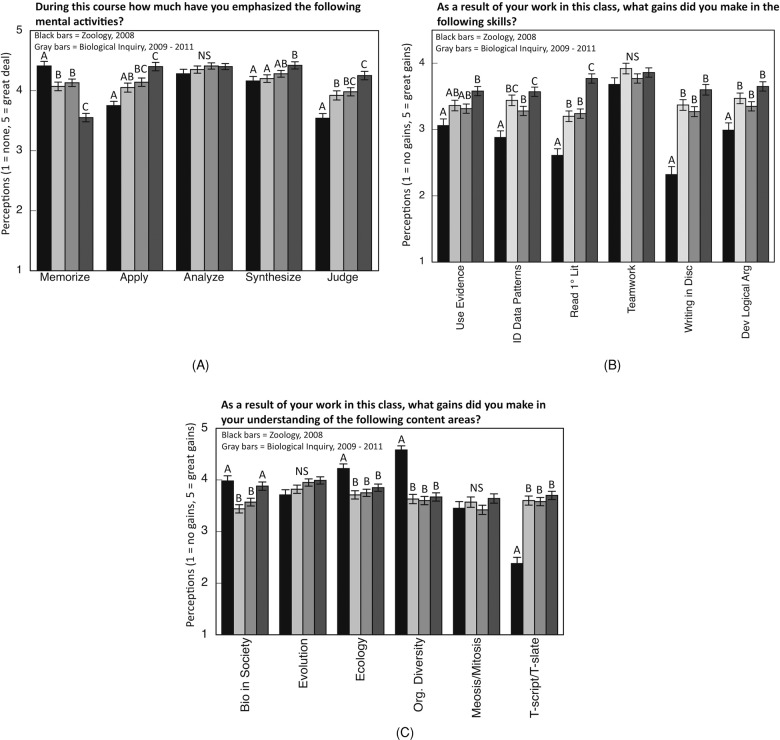
Figure 1.
(A–C) Columns represent average student response (±SE) to selected questions on our end-of-course SALG survey (www.salgsite.org). (A) Student perceptions of how much the course emphasized the various levels of thinking on the Bloom's scale. (B) Student perceptions of their gains in skills. (C) Student perceptions of gains in content knowledge. See the text for a full description of each set of questions. Black columns = Zoology in 2008 (n = 122), gray columns = Biological Inquiry in 2009 (n = 186), 2010 (n = 233), and 2011 (n = 221) from light to darker shades, respectively. Values in adjacent columns denoted by different letters are significantly different from each other. For each question (set of four columns) in each figure, ANOVA was used to detect difference across courses (F > 6, p < 0.001 for all significant effects), and means comparisons were performed using the Tukey-Kramer honestly significant difference test.

