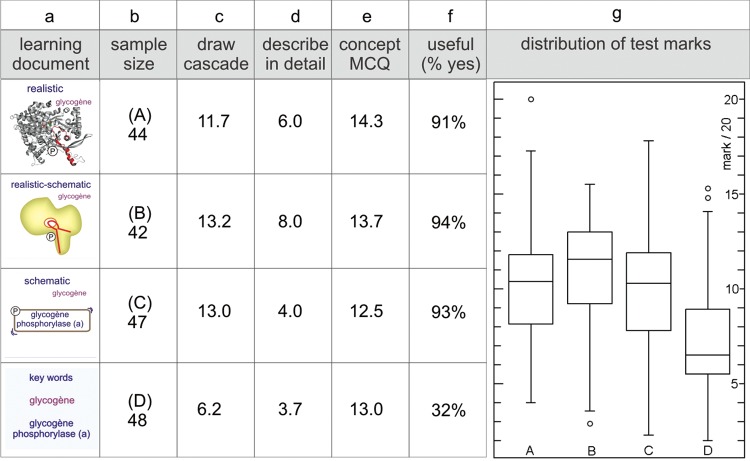
Figure 3.
Outcome of the image test employing different iconographic styles for the representation of the adrenaline-to-glycogen phosphorylase signaling pathway. In an 80-min test protocol, students were provided with one text and one of three different renderings (A–C) of the adrenaline-to-glycogen phosphorylase pathway, ranging from realistic to schematic. The control group (D) received a list of keywords (icons in a). After roughly 45 min of preparation, the learning documents were removed and replaced with a test in which students had to draw the pathway (average results in c), describe in detail the mechanism of activation of glycogen phosphorylase (average results in d), and reply to MCQs (average results in e). At the end, students were asked to indicate whether they regarded the image (or keywords) useful or not (percentage of “yes” replies, f). Notice that with respect to the overall test score (box-and-whisker plot presentation in g), students scored significantly lower when the text was supplemented with a list of keywords only (D). However, the different iconographic styles had equal impact (compare A, B, and C), and the students also found them equally useful. Each test group comprised about 45 subjects (b). Marks were out of 20. There are significant differences between the groups (ANOVA, F = 14.57 and p < 0.0001). The image supplement, independent of its iconographic style, significantly increases the test outcome, but there are no significant differences between the different renderings (A–C).

