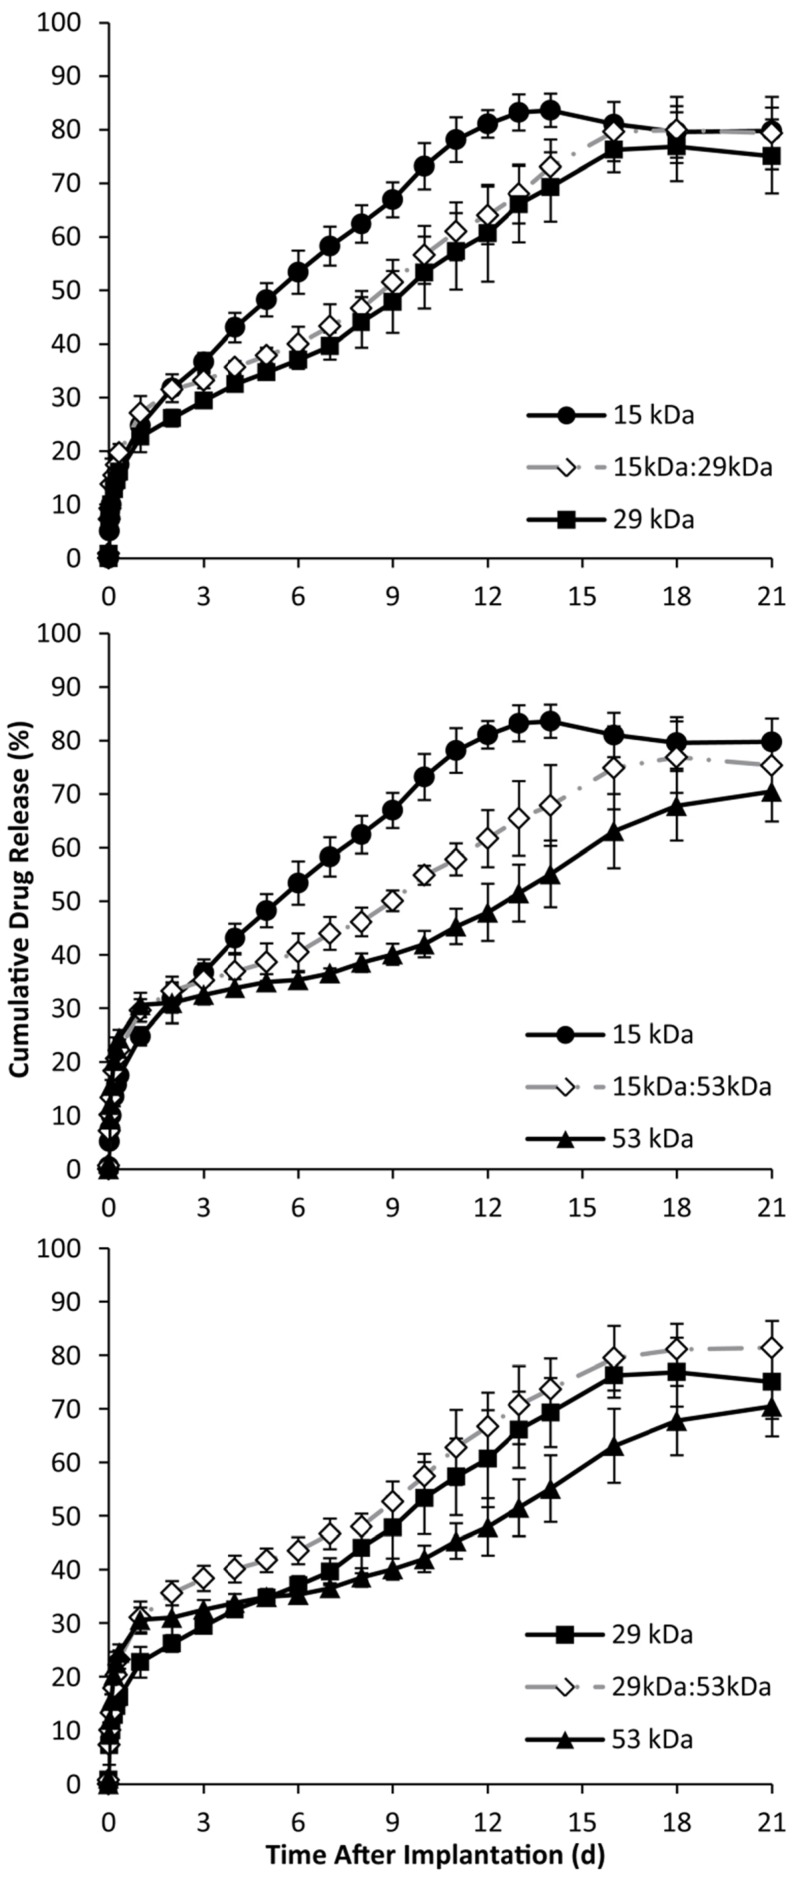
Figure 5.
Cumulative in vitro release of fluorescein over time, with the 15 kDa, 29 kDa, and 15kDa:29kDa blend (A); 15 kDa, 53 kDa, and 15kDa:53kDa blend (B); 29 kDa, 53 kDa, and 29kDa:53kDa blend (C). Blends were plotted with corresponding pure PLGA to demonstrate intermediate behavior of the implants.

