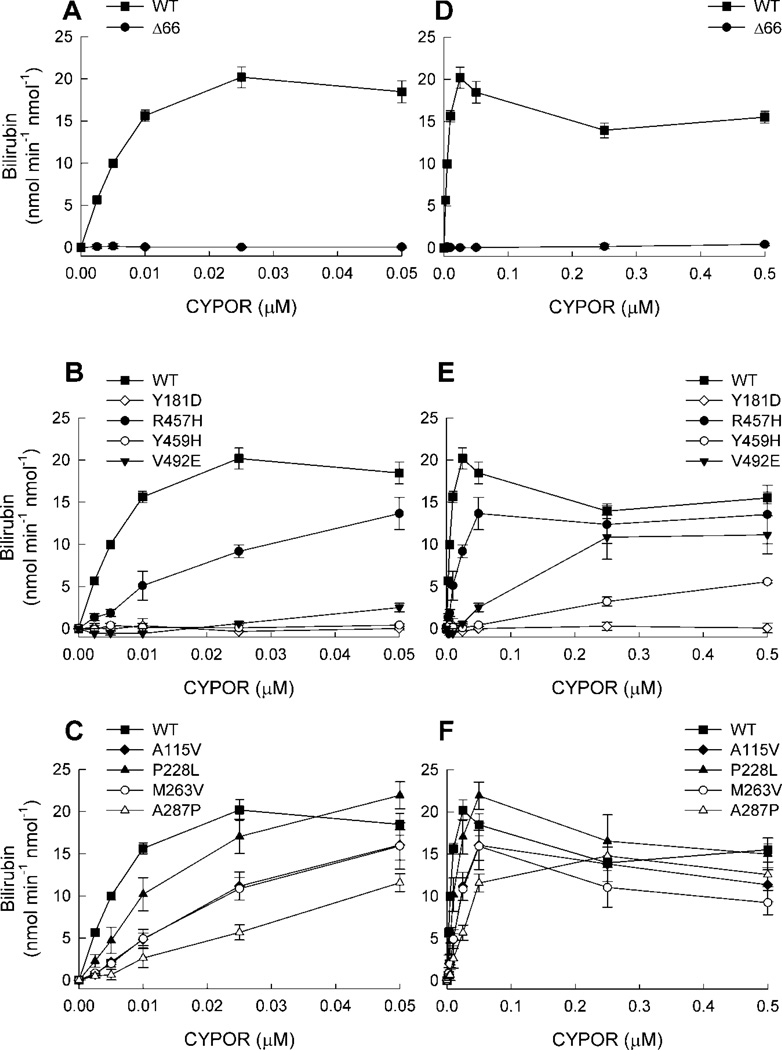
Figure 3. Titration of HO-1 with CYPOR Variants.
Reconstituted systems were prepared with varying concentrations of CYPOR, [HO-1] = 0.05 µM and assayed for HO-1 activity. In each plot, each point represents the mean ± standard deviation of triplicate assays. For comparison, WT CYPOR is shown in each panel. Panels (A), (B), and (C) represent the low range of [CYPOR] ≤ 0.05 µM, and panels (D), (E), and (F) represent the broad range of [CYPOR] ≤ 0.5 µM. See insets for symbol legends.

